<?php
require_once("../lib/phpchartdir.php");
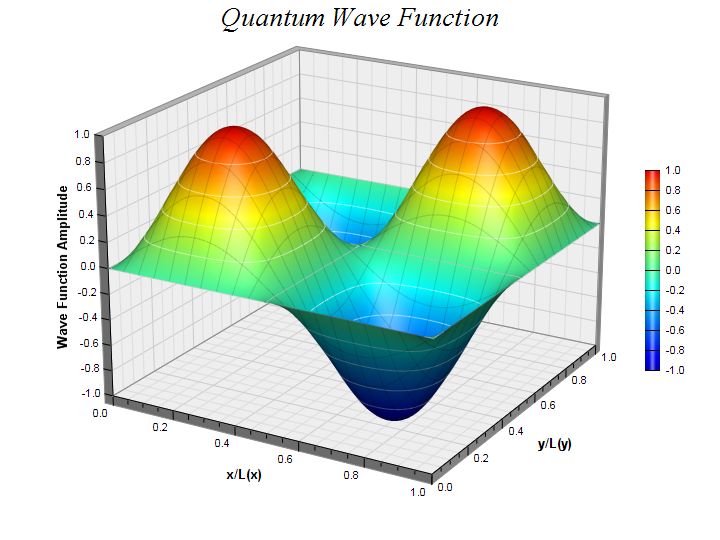
# The x and y coordinates of the grid
$dataX = array(0, 0.1, 0.2, 0.3, 0.4, 0.5, 0.6, 0.7, 0.8, 0.9, 1.0);
$dataY = array(0, 0.1, 0.2, 0.3, 0.4, 0.5, 0.6, 0.7, 0.8, 0.9, 1.0);
# The values at the grid points. In this example, we will compute the values using
# the formula z = sin((x - 0.5) * 2 * pi) * sin((y - 0.5) * 2 * pi)
$dataZ = array_pad(array(), count($dataX) * count($dataY), 0);
for($yIndex = 0; $yIndex < count($dataY); ++$yIndex) {
$y = ($dataY[$yIndex] - 0.5) * 2 * 3.1416;
for($xIndex = 0; $xIndex < count($dataX); ++$xIndex) {
$x = ($dataX[$xIndex] - 0.5) * 2 * 3.1416;
$dataZ[$yIndex * count($dataX) + $xIndex] = sin($x) * sin($y);
}
}
# Create a SurfaceChart object of size 720 x 540 pixels
$c = new SurfaceChart(720, 540);
# Add a title to the chart using 20 points Times New Roman Italic font
$c->addTitle("Quantum Wave Function", "timesi.ttf", 20);
# Set the center of the plot region at (360, 245), and set width x depth x height to
# 360 x 360 x 270 pixels
$c->setPlotRegion(360, 245, 360, 360, 270);
# Set the elevation and rotation angles to 20 and 30 degrees
$c->setViewAngle(20, 30);
# Set the data to use to plot the chart
$c->setData($dataX, $dataY, $dataZ);
# Spline interpolate data to a 80 x 80 grid for a smooth surface
$c->setInterpolation(80, 80);
# Set surface grid lines to semi-transparent black (dd000000)
$c->setSurfaceAxisGrid(0xdd000000);
# Set contour lines to semi-transparent white (80ffffff)
$c->setContourColor(0x80ffffff);
# Add a color axis (the legend) in which the left center is anchored at (645, 270).
# Set the length to 200 pixels and the labels on the right side. Use smooth gradient
# coloring.
$colorAxisObj = $c->setColorAxis(645, 270, Left, 200, Right);
$colorAxisObj->setColorGradient();
# Set the x, y and z axis titles using 10 points Arial Bold font
$c->xAxis->setTitle("x/L(x)", "arialbd.ttf", 10);
$c->yAxis->setTitle("y/L(y)", "arialbd.ttf", 10);
$c->zAxis->setTitle("Wave Function Amplitude", "arialbd.ttf", 10);
# Output the chart
header("Content-type: image/jpeg");
print($c->makeChart2(JPG));
?> |