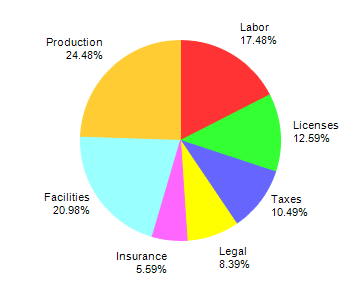
This example demonstrates the basic steps in creating pie charts.
[ASP.NET - VB Version] NetWebCharts\VBNetASP\simplepie.aspx
(Click here on how to convert this code to Visual Studio code-behind style.)
<%@ Page Language="VB" Debug="true" %>
<%@ Import Namespace="ChartDirector" %>
<%@ Register TagPrefix="chart" Namespace="ChartDirector" Assembly="netchartdir" %>
<script runat="server">

'
' Page Load event handler
'
Protected Sub Page_Load(ByVal sender As System.Object, ByVal e As System.EventArgs)

    ' The data for the pie chart
    Dim data() As Double = {25, 18, 15, 12, 8, 30, 35}

    ' The labels for the pie chart
    Dim labels() As String = {"Labor", "Licenses", "Taxes", "Legal", "Insurance", _
        "Facilities", "Production"}

    ' Create a PieChart object of size 360 x 300 pixels
    Dim c As PieChart = New PieChart(360, 300)

    ' Set the center of the pie at (180, 140) and the radius to 100 pixels
    c.setPieSize(180, 140, 100)

    ' Set the pie data and the pie labels
    c.setData(data, labels)

    ' Output the chart
    WebChartViewer1.Image = c.makeWebImage(Chart.PNG)

    ' Include tool tip for the chart
    WebChartViewer1.ImageMap = c.getHTMLImageMap("", "", _
        "title='{label}: US${value}K ({percent}%)'")

End Sub

</script>
<html>
<body>
    <chart:WebChartViewer id="WebChartViewer1" runat="server" />
</body>
</html> |
[ASP.NET - C# Version] NetWebCharts\CSharpASP\simplepie.aspx
(Click here on how to convert this code to Visual Studio code-behind style.)
<%@ Page Language="C#" Debug="true" %>
<%@ Import Namespace="ChartDirector" %>
<%@ Register TagPrefix="chart" Namespace="ChartDirector" Assembly="netchartdir" %>
<script runat="server">

//
// Page Load event handler
//
protected void Page_Load(object sender, EventArgs e)
{
    // The data for the pie chart
    double[] data = {25, 18, 15, 12, 8, 30, 35};

    // The labels for the pie chart
    string[] labels = {"Labor", "Licenses", "Taxes", "Legal", "Insurance",
        "Facilities", "Production"};

    // Create a PieChart object of size 360 x 300 pixels
    PieChart c = new PieChart(360, 300);

    // Set the center of the pie at (180, 140) and the radius to 100 pixels
    c.setPieSize(180, 140, 100);

    // Set the pie data and the pie labels
    c.setData(data, labels);

    // Output the chart
    WebChartViewer1.Image = c.makeWebImage(Chart.PNG);

    // Include tool tip for the chart
    WebChartViewer1.ImageMap = c.getHTMLImageMap("", "",
        "title='{label}: US${value}K ({percent}%)'");
}

</script>
<html>
<body>
    <chart:WebChartViewer id="WebChartViewer1" runat="server" />
</body>
</html> |
[Windows Forms - VB Version] NetWinCharts\VBNetWinCharts\simplepie.vb
Imports System
Imports Microsoft.VisualBasic
Imports ChartDirector

Public Class simplepie
    Implements DemoModule

    'Name of demo module
    Public Function getName() As String Implements DemoModule.getName
        Return "Simple Pie Chart"
    End Function

    'Number of charts produced in this demo module
    Public Function getNoOfCharts() As Integer Implements DemoModule.getNoOfCharts
        Return 1
    End Function

    'Main code for creating chart.
    'Note: the argument img is unused because this demo only has 1 chart.
    Public Sub createChart(viewer As WinChartViewer, img As String) _
        Implements DemoModule.createChart

        ' The data for the pie chart
        Dim data() As Double = {25, 18, 15, 12, 8, 30, 35}

        ' The labels for the pie chart
        Dim labels() As String = {"Labor", "Licenses", "Taxes", "Legal", _
            "Insurance", "Facilities", "Production"}

        ' Create a PieChart object of size 360 x 300 pixels
        Dim c As PieChart = New PieChart(360, 300)

        ' Set the center of the pie at (180, 140) and the radius to 100 pixels
        c.setPieSize(180, 140, 100)

        ' Set the pie data and the pie labels
        c.setData(data, labels)

        ' Output the chart
        viewer.Chart = c

        'include tool tip for the chart
        viewer.ImageMap = c.getHTMLImageMap("clickable", "", _
            "title='{label}: US${value}K ({percent}%)'")

    End Sub

End Class |
[Windows Forms - C# Version] NetWinCharts\CSharpWinCharts\simplepie.cs
using System;
using ChartDirector;

namespace CSharpChartExplorer
{
    public class simplepie : DemoModule
    {
        //Name of demo module
        public string getName() { return "Simple Pie Chart"; }

        //Number of charts produced in this demo module
        public int getNoOfCharts() { return 1; }

        //Main code for creating chart.
        //Note: the argument img is unused because this demo only has 1 chart.
        public void createChart(WinChartViewer viewer, string img)
        {
            // The data for the pie chart
            double[] data = {25, 18, 15, 12, 8, 30, 35};

            // The labels for the pie chart
            string[] labels = {"Labor", "Licenses", "Taxes", "Legal", "Insurance",
                "Facilities", "Production"};

            // Create a PieChart object of size 360 x 300 pixels
            PieChart c = new PieChart(360, 300);

            // Set the center of the pie at (180, 140) and the radius to 100 pixels
            c.setPieSize(180, 140, 100);

            // Set the pie data and the pie labels
            c.setData(data, labels);

            // Output the chart
            viewer.Chart = c;

            //include tool tip for the chart
            viewer.ImageMap = c.getHTMLImageMap("clickable", "",
                "title='{label}: US${value}K ({percent}%)'");
        }
    }
} |
© 2012 Advanced Software Engineering Limited. All rights reserved.