<%@ Page Language="VB" Debug="true" %>
<%@ Import Namespace="ChartDirector" %>
<%@ Register TagPrefix="chart" Namespace="ChartDirector" Assembly="netchartdir" %>
<script runat="server">
'
' Page Load event handler
'
Protected Sub Page_Load(ByVal sender As System.Object, ByVal e As System.EventArgs)
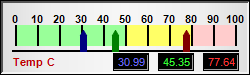
' The values to display on the meter
Dim value0 As Double = 30.99
Dim value1 As Double = 45.35
Dim value2 As Double = 77.64
' Create an LinearMeter object of size 250 x 75 pixels, using silver background
' with a 2 pixel black 3D depressed border.
Dim m As LinearMeter = New LinearMeter(250, 75, Chart.silverColor(), 0, -2)
' Set the scale region top-left corner at (15, 25), with size of 220 x 20 pixels.
' The scale labels are located on the top (implies horizontal meter)
m.setMeter(15, 25, 220, 20, Chart.Top)
' Set meter scale from 0 - 100, with a tick every 10 units
m.setScale(0, 100, 10)
' Set 0 - 50 as green (99ff99) zone, 50 - 80 as yellow (ffff66) zone, and 80 -
' 100 as red (ffcccc) zone
m.addZone(0, 50, &H99ff99)
m.addZone(50, 80, &Hffff66)
m.addZone(80, 100, &Hffcccc)
' Add deep red (000080), deep green (008000) and deep blue (800000) pointers to
' reflect the values
m.addPointer(value0, &H000080)
m.addPointer(value1, &H008000)
m.addPointer(value2, &H800000)
' Add a label at bottom-left (10, 68) using Arial Bold/8 pts/red (c00000)
m.addText(10, 68, "Temp C", "Arial Bold", 8, &Hc00000, Chart.BottomLeft)
' Add three text boxes to show the values in this meter
m.addText(148, 70, m.formatValue(value0, "2"), "Arial", 8, &H6666ff, _
Chart.BottomRight).setBackground(0, 0, -1)
m.addText(193, 70, m.formatValue(value1, "2"), "Arial", 8, &H33ff33, _
Chart.BottomRight).setBackground(0, 0, -1)
m.addText(238, 70, m.formatValue(value2, "2"), "Arial", 8, &Hff3333, _
Chart.BottomRight).setBackground(0, 0, -1)
' Output the chart
WebChartViewer1.Image = m.makeWebImage(Chart.PNG)
End Sub
</script>
<html>
<body>
<chart:WebChartViewer id="WebChartViewer1" runat="server" />
</body>
</html> |