<%@ Page Language="VB" Debug="true" %>
<%@ Import Namespace="ChartDirector" %>
<%@ Register TagPrefix="chart" Namespace="ChartDirector" Assembly="netchartdir" %>
<script runat="server">
'
' Page Load event handler
'
Protected Sub Page_Load(ByVal sender As System.Object, ByVal e As System.EventArgs)
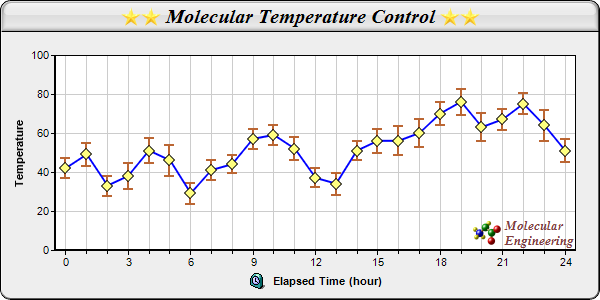
' The data with error information
Dim data() As Double = {42, 49, 33, 38, 51, 46, 29, 41, 44, 57, 59, 52, 37, 34, _
51, 56, 56, 60, 70, 76, 63, 67, 75, 64, 51}
Dim errData() As Double = {5, 6, 5.1, 6.5, 6.6, 8, 5.4, 5.1, 4.6, 5.0, 5.2, _
6.0, 4.9, 5.6, 4.8, 6.2, 7.4, 7.1, 6.0, 6.6, 7.1, 5.3, 5.5, 7.9, 6.1}
' The labels for the chart
Dim labels() As String = {"0", "1", "2", "3", "4", "5", "6", "7", "8", "9", _
"10", "11", "12", "13", "14", "15", "16", "17", "18", "19", "20", "21", _
"22", "23", "24"}
' Create a XYChart object of size 600 x 300 pixels, with a light grey (eeeeee)
' background, black border, 1 pixel 3D border effect and rounded corners.
Dim c As XYChart = New XYChart(600, 300, &Heeeeee, &H000000, 1)
c.setRoundedFrame()
' Set default directory for loading images from current script directory
Call c.setSearchPath(Server.MapPath("."))
' Set the plotarea at (55, 55) and of size 520 x 195 pixels, with white (ffffff)
' background. Set horizontal and vertical grid lines to grey (cccccc).
c.setPlotArea(55, 55, 520, 195, &Hffffff, -1, -1, &Hcccccc, &Hcccccc)
' Add a title box to the chart using 15 pts Times Bold Italic font. The title is
' in CDML and includes embedded images for highlight. The text is on a light grey
' (dddddd) background, with glass lighting effect.
c.addTitle( _
"<*block,valign=absmiddle*><*img=star.png*><*img=star.png*> Molecular " & _
"Temperature Control <*img=star.png*><*img=star.png*><*/*>", _
"Times New Roman Bold Italic", 15).setBackground(&Hdddddd, 0, _
Chart.glassEffect())
' Add a title to the y axis
c.yAxis().setTitle("Temperature")
' Add a title to the x axis using CMDL
c.xAxis().setTitle( _
"<*block,valign=absmiddle*><*img=clock.png*> Elapsed Time (hour)<*/*>")
' Set the labels on the x axis.
c.xAxis().setLabels(labels)
' Display 1 out of 3 labels on the x-axis. Show minor ticks for remaining labels.
c.xAxis().setLabelStep(3, 1)
' Set the axes width to 2 pixels
c.xAxis().setWidth(2)
c.yAxis().setWidth(2)
' Add a line layer to the chart
Dim lineLayer As LineLayer = c.addLineLayer2()
' Add a blue (0xff) data set to the line layer, with yellow (0xffff80) diamond
' symbols
lineLayer.addDataSet(data, &H0000ff).setDataSymbol(Chart.DiamondSymbol, 12, _
&Hffff80)
' Set the line width to 2 pixels
lineLayer.setLineWidth(2)
' Add a box whisker layer to the chart. Use the upper and lower mark of the box
' whisker layer to act as error zones. The upper and lower marks are computed
' using the ArrayMath object.
Dim errLayer As BoxWhiskerLayer = c.addBoxWhiskerLayer(Nothing, Nothing, _
New ArrayMath(data).add(errData).result(), New ArrayMath(data).sub(errData _
).result(), data, Chart.Transparent, &Hbb6633)
' Set the line width to 2 pixels
errLayer.setLineWidth(2)
' Set the error zone to occupy half the space between the symbols
errLayer.setDataGap(0.5)
' Add a custom CDML text at the bottom right of the plot area as the logo
c.addText(575, 247, _
"<*block,valign=absmiddle*><*img=small_molecule.png*> <*block*>" & _
"<*font=Times New Roman Bold Italic,size=10,color=804040*>Molecular" & _
"<*br*>Engineering<*/*>").setAlignment(Chart.BottomRight)
' Output the chart
WebChartViewer1.Image = c.makeWebImage(Chart.PNG)
' Include tool tip for the chart. We only need to show the tool tip for the box
' whisker layer.
WebChartViewer1.ImageMap = errLayer.getHTMLImageMap("", "", _
"title='Temperature at hour {xLabel}: {med} +/- {={med}-{min}} C'")
End Sub
</script>
<html>
<body>
<chart:WebChartViewer id="WebChartViewer1" runat="server" />
</body>
</html> |