ChartDirector 5.1 (.NET Edition)

Start Angle and Direction


This example demonstrates different sector layout angles and directions.

By default, ChartDirector positions sectors starting from the upward pointing position, and in clockwise direction.

The start angle and layout direction can be changed using PieChart.setStartAngle.

One common application for PieChart.setStartAngle is to facilitate layout of pie charts containing many small sectors. Please refer to Side Label Layout for an example.

Source Code Listing

[ASP.NET - VB Version] NetWebCharts\VBNetASP\anglepie.aspx
(Click here on how to convert this code to Visual Studio code-behind style.)
<%@ Page Language="VB" Debug="true" %>
<%@ Import Namespace="ChartDirector" %>
<%@ Register TagPrefix="chart" Namespace="ChartDirector" Assembly="netchartdir" %>
<script runat="server">

'
' Create chart
'
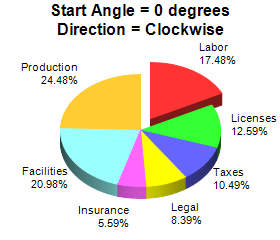
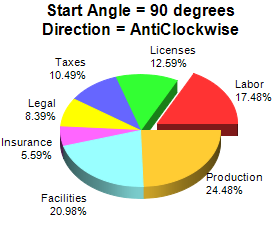
Protected Sub createChart(viewer As WebChartViewer, img As String)

    ' Determine the starting angle and direction based on input parameter
    Dim angle As Integer = 0
    Dim clockwise As Boolean = True
    If img <> "0" Then
        angle = 90
        clockwise = False
    End If

    ' The data for the pie chart
    Dim data() As Double = {25, 18, 15, 12, 8, 30, 35}

    ' The labels for the pie chart
    Dim labels() As String = {"Labor", "Licenses", "Taxes", "Legal", "Insurance", _
        "Facilities", "Production"}

    ' Create a PieChart object of size 280 x 240 pixels
    Dim c As PieChart = New PieChart(280, 240)

    ' Set the center of the pie at (140, 130) and the radius to 80 pixels
    c.setPieSize(140, 130, 80)

    ' Add a title to the pie to show the start angle and direction
    If clockwise Then
        c.addTitle("Start Angle = " & angle & " degrees<*br*>Direction = Clockwise")
    Else
        c.addTitle("Start Angle = " & angle & _
            " degrees<*br*>Direction = AntiClockwise")
    End If

    ' Set the pie start angle and direction
    c.setStartAngle(angle, clockwise)

    ' Draw the pie in 3D
    c.set3D()

    ' Set the pie data and the pie labels
    c.setData(data, labels)

    ' Explode the 1st sector (index = 0)
    c.setExplode(0)

    ' Output the chart
    viewer.Image = c.makeWebImage(Chart.PNG)

    ' Include tool tip for the chart
    viewer.ImageMap = c.getHTMLImageMap("", "", _
        "title='{label}: US${value}K ({percent}%)'")

End Sub

'
' Page Load event handler
'
Protected Sub Page_Load(ByVal sender As System.Object, ByVal e As System.EventArgs)

    createChart(WebChartViewer0, "0")
    createChart(WebChartViewer1, "1")

End Sub

</script>
<html>
<body>
    <chart:WebChartViewer id="WebChartViewer0" runat="server" />
    <chart:WebChartViewer id="WebChartViewer1" runat="server" />
</body>
</html>

[ASP.NET - C# Version] NetWebCharts\CSharpASP\anglepie.aspx
(Click here on how to convert this code to Visual Studio code-behind style.)
<%@ Page Language="C#" Debug="true" %>
<%@ Import Namespace="ChartDirector" %>
<%@ Register TagPrefix="chart" Namespace="ChartDirector" Assembly="netchartdir" %>
<script runat="server">

//
// Create chart
//
protected void createChart(WebChartViewer viewer, string img)
{
    // Determine the starting angle and direction based on input parameter
    int angle = 0;
    bool clockwise = true;
    if (img != "0") {
        angle = 90;
        clockwise = false;
    }

    // The data for the pie chart
    double[] data = {25, 18, 15, 12, 8, 30, 35};

    // The labels for the pie chart
    string[] labels = {"Labor", "Licenses", "Taxes", "Legal", "Insurance",
        "Facilities", "Production"};

    // Create a PieChart object of size 280 x 240 pixels
    PieChart c = new PieChart(280, 240);

    // Set the center of the pie at (140, 130) and the radius to 80 pixels
    c.setPieSize(140, 130, 80);

    // Add a title to the pie to show the start angle and direction
    if (clockwise) {
        c.addTitle("Start Angle = " + angle + " degrees\nDirection = Clockwise");
    } else {
        c.addTitle("Start Angle = " + angle + " degrees\nDirection = AntiClockwise");
    }

    // Set the pie start angle and direction
    c.setStartAngle(angle, clockwise);

    // Draw the pie in 3D
    c.set3D();

    // Set the pie data and the pie labels
    c.setData(data, labels);

    // Explode the 1st sector (index = 0)
    c.setExplode(0);

    // Output the chart
    viewer.Image = c.makeWebImage(Chart.PNG);

    // Include tool tip for the chart
    viewer.ImageMap = c.getHTMLImageMap("", "",
        "title='{label}: US${value}K ({percent}%)'");
}

//
// Page Load event handler
//
protected void Page_Load(object sender, EventArgs e)
{
    createChart(WebChartViewer0, "0");
    createChart(WebChartViewer1, "1");
}

</script>
<html>
<body>
    <chart:WebChartViewer id="WebChartViewer0" runat="server" />
    <chart:WebChartViewer id="WebChartViewer1" runat="server" />
</body>
</html>

[Windows Forms - VB Version] NetWinCharts\VBNetWinCharts\anglepie.vb
Imports System
Imports Microsoft.VisualBasic
Imports ChartDirector

Public Class anglepie
    Implements DemoModule

    'Name of demo module
    Public Function getName() As String Implements DemoModule.getName
        Return "Start Angle and Direction"
    End Function

    'Number of charts produced in this demo module
    Public Function getNoOfCharts() As Integer Implements DemoModule.getNoOfCharts
        Return 2
    End Function

    'Main code for creating charts
    Public Sub createChart(viewer As WinChartViewer, img As String) _
        Implements DemoModule.createChart

        ' Determine the starting angle and direction based on input parameter
        Dim angle As Integer = 0
        Dim clockwise As Boolean = True
        If img <> "0" Then
            angle = 90
            clockwise = False
        End If

        ' The data for the pie chart
        Dim data() As Double = {25, 18, 15, 12, 8, 30, 35}

        ' The labels for the pie chart
        Dim labels() As String = {"Labor", "Licenses", "Taxes", "Legal", _
            "Insurance", "Facilities", "Production"}

        ' Create a PieChart object of size 280 x 240 pixels
        Dim c As PieChart = New PieChart(280, 240)

        ' Set the center of the pie at (140, 130) and the radius to 80 pixels
        c.setPieSize(140, 130, 80)

        ' Add a title to the pie to show the start angle and direction
        If clockwise Then
            c.addTitle("Start Angle = " & angle & _
                " degrees<*br*>Direction = Clockwise")
        Else
            c.addTitle("Start Angle = " & angle & _
                " degrees<*br*>Direction = AntiClockwise")
        End If

        ' Set the pie start angle and direction
        c.setStartAngle(angle, clockwise)

        ' Draw the pie in 3D
        c.set3D()

        ' Set the pie data and the pie labels
        c.setData(data, labels)

        ' Explode the 1st sector (index = 0)
        c.setExplode(0)

        ' Output the chart
        viewer.Chart = c

        'include tool tip for the chart
        viewer.ImageMap = c.getHTMLImageMap("clickable", "", _
            "title='{label}: US${value}K ({percent}%)'")

    End Sub

End Class

[Windows Forms - C# Version] NetWinCharts\CSharpWinCharts\anglepie.cs
using System;
using ChartDirector;

namespace CSharpChartExplorer
{
    public class anglepie : DemoModule
    {
        //Name of demo module
        public string getName() { return "Start Angle and Direction"; }

        //Number of charts produced in this demo module
        public int getNoOfCharts() { return 2; }

        //Main code for creating charts
        public void createChart(WinChartViewer viewer, string img)
        {
            // Determine the starting angle and direction based on input parameter
            int angle = 0;
            bool clockwise = true;
            if (img != "0") {
                angle = 90;
                clockwise = false;
            }

            // The data for the pie chart
            double[] data = {25, 18, 15, 12, 8, 30, 35};

            // The labels for the pie chart
            string[] labels = {"Labor", "Licenses", "Taxes", "Legal", "Insurance",
                "Facilities", "Production"};

            // Create a PieChart object of size 280 x 240 pixels
            PieChart c = new PieChart(280, 240);

            // Set the center of the pie at (140, 130) and the radius to 80 pixels
            c.setPieSize(140, 130, 80);

            // Add a title to the pie to show the start angle and direction
            if (clockwise) {
                c.addTitle("Start Angle = " + angle +
                    " degrees\nDirection = Clockwise");
            } else {
                c.addTitle("Start Angle = " + angle +
                    " degrees\nDirection = AntiClockwise");
            }

            // Set the pie start angle and direction
            c.setStartAngle(angle, clockwise);

            // Draw the pie in 3D
            c.set3D();

            // Set the pie data and the pie labels
            c.setData(data, labels);

            // Explode the 1st sector (index = 0)
            c.setExplode(0);

            // Output the chart
            viewer.Chart = c;

            //include tool tip for the chart
            viewer.ImageMap = c.getHTMLImageMap("clickable", "",
                "title='{label}: US${value}K ({percent}%)'");
        }
    }
}