ChartDirector 6.0 (Perl Edition)
Uneven Data Points
Source Code Listing
#!/usr/bin/perl # In the sample code, the ChartDirector for Perl module is assumed to be in "../lib" use File::Basename; use lib (dirname($0)."/../lib") =~ /(.*)/; use perlchartdir; # Data points which more unevenly spaced in time my $data0Y = [62, 69, 53, 58, 84, 76, 49, 61, 64, 77, 79]; my $data0X = [perlchartdir::chartTime(2007, 1, 1), perlchartdir::chartTime(2007, 1, 2), perlchartdir::chartTime(2007, 1, 5), perlchartdir::chartTime(2007, 1, 7), perlchartdir::chartTime(2007, 1, 10), perlchartdir::chartTime(2007, 1, 14), perlchartdir::chartTime(2007, 1, 17), perlchartdir::chartTime(2007, 1, 18), perlchartdir::chartTime(2007, 1, 19), perlchartdir::chartTime(2007, 1, 20), perlchartdir::chartTime(2007, 1, 21)]; # Data points which are evenly spaced in a certain time range my $data1Y = [36, 25, 28, 38, 20, 30, 27, 35, 65, 60, 40, 73, 62, 90, 75, 72]; my $data1Start = perlchartdir::chartTime(2007, 1, 1); my $data1End = perlchartdir::chartTime(2007, 1, 16); # Data points which are evenly spaced in another time range, in which the spacing is different from # the above series my $data2Y = [25, 15, 30, 23, 32, 55, 45]; my $data2Start = perlchartdir::chartTime(2007, 1, 9); my $data2End = perlchartdir::chartTime(2007, 1, 21); # Create a XYChart object of size 600 x 400 pixels. Use a vertical gradient color from light blue # (99ccff) to white (ffffff) spanning the top 100 pixels as background. Set border to grey (888888). # Use rounded corners. Enable soft drop shadow. my $c = new XYChart(600, 400); $c->setBackground($c->linearGradientColor(0, 0, 0, 100, 0x99ccff, 0xffffff), 0x888888); $c->setRoundedFrame(); $c->setDropShadow(); # Add a title using 18pt Times New Roman Bold Italic font. Set top margin to 16 pixels. $c->addTitle("Product Line Order Backlog", "timesbi.ttf", 18)->setMargin2(0, 0, 16, 0); # Set the plotarea at (60, 80) and of 510 x 275 pixels in size. Use transparent border and dark grey # (444444) dotted grid lines my $plotArea = $c->setPlotArea(60, 80, 510, 275, -1, -1, $perlchartdir::Transparent, $c->dashLineColor(0x444444, 0x0101), -1); # Add a legend box where the top-center is anchored to the horizontal center of the plot area at y = # 45. Use horizontal layout and 10 points Arial Bold font, and transparent background and border. my $legendBox = $c->addLegend($plotArea->getLeftX() + $plotArea->getWidth() / 2, 45, 0, "arialbd.ttf", 10); $legendBox->setAlignment($perlchartdir::TopCenter); $legendBox->setBackground($perlchartdir::Transparent, $perlchartdir::Transparent); # Set x-axis tick density to 75 pixels and y-axis tick density to 30 pixels. ChartDirector # auto-scaling will use this as the guidelines when putting ticks on the x-axis and y-axis. $c->yAxis()->setTickDensity(30); $c->xAxis()->setTickDensity(75); # Set all axes to transparent $c->xAxis()->setColors($perlchartdir::Transparent); $c->yAxis()->setColors($perlchartdir::Transparent); # Set the x-axis margins to 15 pixels, so that the horizontal grid lines can extend beyond the # leftmost and rightmost vertical grid lines $c->xAxis()->setMargin(15, 15); # Set axis label style to 8pt Arial Bold $c->xAxis()->setLabelStyle("arialbd.ttf", 8); $c->yAxis()->setLabelStyle("arialbd.ttf", 8); $c->yAxis2()->setLabelStyle("arialbd.ttf", 8); # Add axis title using 10pt Arial Bold Italic font $c->yAxis()->setTitle("Backlog in USD millions", "arialbi.ttf", 10); # Add the first data series my $layer0 = $c->addLineLayer2(); $layer0->addDataSet($data0Y, 0xff0000, "Quantum Computer")->setDataSymbol( $perlchartdir::GlassSphere2Shape, 11); $layer0->setXData($data0X); $layer0->setLineWidth(3); # Add the second data series my $layer1 = $c->addLineLayer2(); $layer1->addDataSet($data1Y, 0x00ff00, "Atom Synthesizer")->setDataSymbol( $perlchartdir::GlassSphere2Shape, 11); $layer1->setXData2($data1Start, $data1End); $layer1->setLineWidth(3); # Add the third data series my $layer2 = $c->addLineLayer2(); $layer2->addDataSet($data2Y, 0xff6600, "Proton Cannon")->setDataSymbol( $perlchartdir::GlassSphere2Shape, 11); $layer2->setXData2($data2Start, $data2End); $layer2->setLineWidth(3); # Output the chart $c->makeChart("unevenpoints.png") |
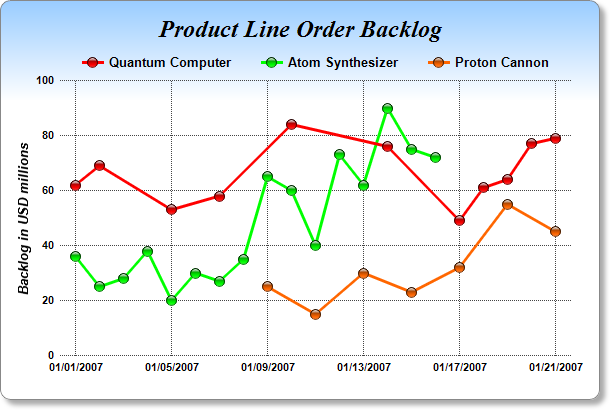
#!/usr/bin/perl # In the sample code, the ChartDirector for Perl module is assumed to be in "../lib" use File::Basename; use lib (dirname($0)."/../lib") =~ /(.*)/; use perlchartdir; # Data points which more unevenly spaced in time my $data0Y = [62, 69, 53, 58, 84, 76, 49, 61, 64, 77, 79]; my $data0X = [perlchartdir::chartTime(2007, 1, 1), perlchartdir::chartTime(2007, 1, 2), perlchartdir::chartTime(2007, 1, 5), perlchartdir::chartTime(2007, 1, 7), perlchartdir::chartTime(2007, 1, 10), perlchartdir::chartTime(2007, 1, 14), perlchartdir::chartTime(2007, 1, 17), perlchartdir::chartTime(2007, 1, 18), perlchartdir::chartTime(2007, 1, 19), perlchartdir::chartTime(2007, 1, 20), perlchartdir::chartTime(2007, 1, 21)]; # Data points which are evenly spaced in a certain time range my $data1Y = [36, 25, 28, 38, 20, 30, 27, 35, 65, 60, 40, 73, 62, 90, 75, 72]; my $data1Start = perlchartdir::chartTime(2007, 1, 1); my $data1End = perlchartdir::chartTime(2007, 1, 16); # Data points which are evenly spaced in another time range, in which the spacing is different from # the above series my $data2Y = [25, 15, 30, 23, 32, 55, 45]; my $data2Start = perlchartdir::chartTime(2007, 1, 9); my $data2End = perlchartdir::chartTime(2007, 1, 21); # Create a XYChart object of size 600 x 400 pixels. Use a vertical gradient color from light blue # (99ccff) to white (ffffff) spanning the top 100 pixels as background. Set border to grey (888888). # Use rounded corners. Enable soft drop shadow. my $c = new XYChart(600, 400); $c->setBackground($c->linearGradientColor(0, 0, 0, 100, 0x99ccff, 0xffffff), 0x888888); $c->setRoundedFrame(); $c->setDropShadow(); # Add a title using 18pt Times New Roman Bold Italic font. Set top margin to 16 pixels. $c->addTitle("Product Line Order Backlog", "timesbi.ttf", 18)->setMargin2(0, 0, 16, 0); # Set the plotarea at (60, 80) and of 510 x 275 pixels in size. Use transparent border and dark grey # (444444) dotted grid lines my $plotArea = $c->setPlotArea(60, 80, 510, 275, -1, -1, $perlchartdir::Transparent, $c->dashLineColor(0x444444, 0x0101), -1); # Add a legend box where the top-center is anchored to the horizontal center of the plot area at y = # 45. Use horizontal layout and 10 points Arial Bold font, and transparent background and border. my $legendBox = $c->addLegend($plotArea->getLeftX() + $plotArea->getWidth() / 2, 45, 0, "arialbd.ttf", 10); $legendBox->setAlignment($perlchartdir::TopCenter); $legendBox->setBackground($perlchartdir::Transparent, $perlchartdir::Transparent); # Set x-axis tick density to 75 pixels and y-axis tick density to 30 pixels. ChartDirector # auto-scaling will use this as the guidelines when putting ticks on the x-axis and y-axis. $c->yAxis()->setTickDensity(30); $c->xAxis()->setTickDensity(75); # Set all axes to transparent $c->xAxis()->setColors($perlchartdir::Transparent); $c->yAxis()->setColors($perlchartdir::Transparent); # Set the x-axis margins to 15 pixels, so that the horizontal grid lines can extend beyond the # leftmost and rightmost vertical grid lines $c->xAxis()->setMargin(15, 15); # Set axis label style to 8pt Arial Bold $c->xAxis()->setLabelStyle("arialbd.ttf", 8); $c->yAxis()->setLabelStyle("arialbd.ttf", 8); $c->yAxis2()->setLabelStyle("arialbd.ttf", 8); # Add axis title using 10pt Arial Bold Italic font $c->yAxis()->setTitle("Backlog in USD millions", "arialbi.ttf", 10); # Add the first data series my $layer0 = $c->addLineLayer2(); $layer0->addDataSet($data0Y, 0xff0000, "Quantum Computer")->setDataSymbol( $perlchartdir::GlassSphere2Shape, 11); $layer0->setXData($data0X); $layer0->setLineWidth(3); # Add the second data series my $layer1 = $c->addLineLayer2(); $layer1->addDataSet($data1Y, 0x00ff00, "Atom Synthesizer")->setDataSymbol( $perlchartdir::GlassSphere2Shape, 11); $layer1->setXData2($data1Start, $data1End); $layer1->setLineWidth(3); # Add the third data series my $layer2 = $c->addLineLayer2(); $layer2->addDataSet($data2Y, 0xff6600, "Proton Cannon")->setDataSymbol( $perlchartdir::GlassSphere2Shape, 11); $layer2->setXData2($data2Start, $data2End); $layer2->setLineWidth(3); # Output the chart binmode(STDOUT); print "Content-type: image/png\n\n"; print $c->makeChart2($perlchartdir::PNG); |