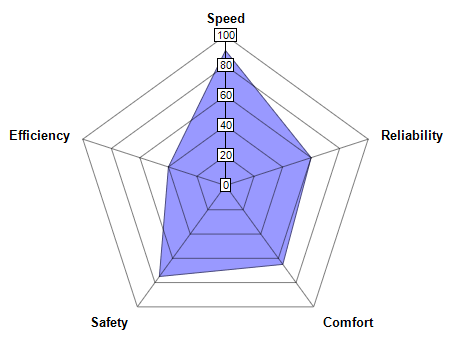
This example demonstrates the basic steps in creating radar charts.
[Standalone Version] perldemo\simpleradar.pl
#!/usr/bin/perl

# In the sample code, the ChartDirector for Perl module is assumed to be in "../lib"
use File::Basename;
use lib (dirname($0)."/../lib") =~ /(.*)/;

use perlchartdir;

# The data for the chart
my $data = [90, 60, 65, 75, 40];

# The labels for the chart
my $labels = ["Speed", "Reliability", "Comfort", "Safety", "Efficiency"];

# Create a PolarChart object of size 450 x 350 pixels
my $c = new PolarChart(450, 350);

# Set center of plot area at (225, 185) with radius 150 pixels
$c->setPlotArea(225, 185, 150);

# Add an area layer to the polar chart
$c->addAreaLayer($data, 0x9999ff);

# Set the labels to the angular axis as spokes
$c->angularAxis()->setLabels($labels);

# Output the chart
$c->makeChart("simpleradar.png") |
[CGI Version] perldemo_cgi\simpleradar.pl
#!/usr/bin/perl

# In the sample code, the ChartDirector for Perl module is assumed to be in "../lib"
use File::Basename;
use lib (dirname($0)."/../lib") =~ /(.*)/;

use perlchartdir;

# The data for the chart
my $data = [90, 60, 65, 75, 40];

# The labels for the chart
my $labels = ["Speed", "Reliability", "Comfort", "Safety", "Efficiency"];

# Create a PolarChart object of size 450 x 350 pixels
my $c = new PolarChart(450, 350);

# Set center of plot area at (225, 185) with radius 150 pixels
$c->setPlotArea(225, 185, 150);

# Add an area layer to the polar chart
$c->addAreaLayer($data, 0x9999ff);

# Set the labels to the angular axis as spokes
$c->angularAxis()->setLabels($labels);

# Output the chart
binmode(STDOUT);
print "Content-type: image/png\n\n";
print $c->makeChart2($perlchartdir::PNG); |
© 2017 Advanced Software Engineering Limited. All rights reserved.
