This example demonstrates an alternative 3D drawing method that uses shadows.
The standard way to draw a pie chart in 3D is to view the chart from an inclined angle. Using this method, the surface of a 3D pie will become an ellipse.
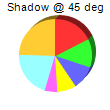
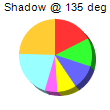
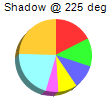
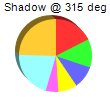
ChartDirector supports an alternative way to draw a pie chart in 3D - to draw the 3D portion like a shadow. The 3D pie will remain perfectly circular, and the sector areas will correctly reflect its percentages.
The 3D drawing method is configured using
PieChart.set3D.
[Standalone Version] perldemo\shadowpie.pl
#!/usr/bin/perl

# In the sample code, the ChartDirector for Perl module is assumed to be in "../lib"
use File::Basename;
use lib (dirname($0)."/../lib") =~ /(.*)/;

use perlchartdir;

sub createChart
{
    my $chartIndex = shift;

    # the tilt angle of the pie
    my $angle = $chartIndex * 90 + 45;

    # The data for the pie chart
    my $data = [25, 18, 15, 12, 8, 30, 35];

    # Create a PieChart object of size 110 x 110 pixels
    my $c = new PieChart(110, 110);

    # Set the center of the pie at (50, 55) and the radius to 36 pixels
    $c->setPieSize(55, 55, 36);

    # Set the depth, tilt angle and 3D mode of the 3D pie (-1 means auto depth, "true" means the 3D
    # effect is in shadow mode)
    $c->set3D(-1, $angle, 1);

    # Add a title showing the shadow angle
    $c->addTitle("Shadow @ $angle deg", "arial.ttf", 8);

    # Set the pie data
    $c->setData($data);

    # Disable the sector labels by setting the color to Transparent
    $c->setLabelStyle("", 8, $perlchartdir::Transparent);

    # Output the chart
    $c->makeChart("shadowpie$chartIndex.png")
}

createChart(0);
createChart(1);
createChart(2);
createChart(3); |
[CGI Version] perldemo_cgi\shadowpie.pl
#!/usr/bin/perl

# In the sample code, the ChartDirector for Perl module is assumed to be in "../lib"
use File::Basename;
use lib (dirname($0)."/../lib") =~ /(.*)/;

use perlchartdir;

# Get HTTP query parameters
use CGI;
my $query = new CGI;

# This script can draw different charts depending on the chartIndex
$chartIndex = int($query->param("img"));

# the tilt angle of the pie
my $angle = $chartIndex * 90 + 45;

# The data for the pie chart
my $data = [25, 18, 15, 12, 8, 30, 35];

# Create a PieChart object of size 110 x 110 pixels
my $c = new PieChart(110, 110);

# Set the center of the pie at (50, 55) and the radius to 36 pixels
$c->setPieSize(55, 55, 36);

# Set the depth, tilt angle and 3D mode of the 3D pie (-1 means auto depth, "true" means the 3D
# effect is in shadow mode)
$c->set3D(-1, $angle, 1);

# Add a title showing the shadow angle
$c->addTitle("Shadow @ $angle deg", "arial.ttf", 8);

# Set the pie data
$c->setData($data);

# Disable the sector labels by setting the color to Transparent
$c->setLabelStyle("", 8, $perlchartdir::Transparent);

# Output the chart
binmode(STDOUT);
print "Content-type: image/png\n\n";
print $c->makeChart2($perlchartdir::PNG); |
© 2017 Advanced Software Engineering Limited. All rights reserved.