#!/usr/bin/perl
# In the sample code, the ChartDirector for Perl module is assumed to be in "../lib"
use File::Basename;
use lib (dirname($0)."/../lib") =~ /(.*)/;
use perlchartdir;
# Get HTTP query parameters
use CGI;
my $query = new CGI;
#
# In this demo, the generated web page needs to load the "cdjcv.js" Javascript file and several GIF
# files. For ease of installation, we put these files in the same directory as this script. However,
# if this script is installed in a CGI only directory (such as cgi-bin), the web server would not
# allow the browser to access these non-CGI files.
#
# To get around this potential issue, a special load resource script is used to load these files.
# Instead of using:
#
# <SCRIPT SRC="cdjcv.js">
#
# we now use:
#
# <SCRIPT SRC="loadresource.pl?file=cdjcv.js">
#
# Similar methods are used to load the GIF files.
#
# If this script is not in a CGI only directory, you may replace the following loadResource string
# with an empty string "" to improve performance.
#
my $loadResource = "loadresource.pl?file=";
#
# Draw the chart
#
sub drawChart
{
my ($viewer) = @_;
#
# Data to draw the chart. In this demo, the data buffer will be filled by a random data
# generator. In real life, the data is probably stored in a buffer (eg. a database table, a text
# file, or some global memory) and updated by other means.
#
# We use a data buffer to emulate the last 240 samples.
my $sampleSize = 240;
my $dataSeries1 = [(0) x $sampleSize];
my $dataSeries2 = [(0) x $sampleSize];
my $dataSeries3 = [(0) x $sampleSize];
my $timeStamps = [(0) x $sampleSize];
# Our pseudo random number generator
my $firstDate = perlchartdir::chartTime2(time()) - scalar(@$timeStamps);
for(my $i = 0; $i < scalar(@$timeStamps); ++$i) {
my $p = $firstDate + $i;
$timeStamps->[$i] = $p;
$dataSeries1->[$i] = cos($p * 2.1) * 10 + 1 / (cos($p) * cos($p) + 0.01) + 20;
$dataSeries2->[$i] = 100 * sin($p / 27.7) * sin($p / 10.1) + 150;
$dataSeries3->[$i] = 100 * cos($p / 6.7) * cos($p / 11.9) + 150;
}
# Create an XYChart object 600 x 270 pixels in size, with light grey (f4f4f4) background, black
# (000000) border, 1 pixel raised effect, and with a rounded frame.
my $c = new XYChart(600, 270, 0xf4f4f4, 0x000000, 0);
$c->setRoundedFrame();
# Set the plotarea at (55, 57) and of size 520 x 185 pixels. Use white (ffffff) background.
# Enable both horizontal and vertical grids by setting their colors to grey (cccccc). Set
# clipping mode to clip the data lines to the plot area.
$c->setPlotArea(55, 57, 520, 185, 0xffffff, -1, -1, 0xcccccc, 0xcccccc);
$c->setClipping();
# Add a title to the chart using 15pt Times New Roman Bold Italic font, with a light grey
# (dddddd) background, black (000000) border, and a glass like raised effect.
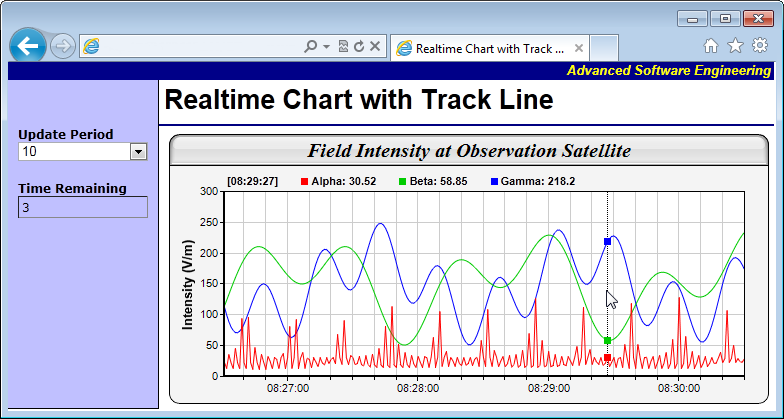
$c->addTitle("Field Intensity at Observation Satellite", "timesbi.ttf", 15)->setBackground(
0xdddddd, 0x000000, perlchartdir::glassEffect());
# Configure the y-axis with a 10pt Arial Bold axis title
$c->yAxis()->setTitle("Intensity (V/m)", "arialbd.ttf", 10);
# Configure the x-axis to auto-scale with at least 75 pixels between major tick and 15 pixels
# between minor ticks. This shows more minor grid lines on the chart.
$c->xAxis()->setTickDensity(75, 15);
# Set the axes width to 2 pixels
$c->xAxis()->setWidth(2);
$c->yAxis()->setWidth(2);
# Set the x-axis label format
$c->xAxis()->setLabelFormat("{value|hh:nn:ss}");
# Create a line layer to plot the lines
my $layer = $c->addLineLayer2();
# The x-coordinates are the timeStamps.
$layer->setXData($timeStamps);
# The 3 data series are used to draw 3 lines. Here we put the latest data values as part of the
# data set name, so you can see them updated in the legend box.
$layer->addDataSet($dataSeries1, 0xff0000, "Alpha");
$layer->addDataSet($dataSeries2, 0x00cc00, "Beta");
$layer->addDataSet($dataSeries3, 0x0000ff, "Gamma");
# Output the chart
my $chartQuery = $c->makeTmpFile("/tmp/tmpcharts");
# Set the chart URL to the viewer
$viewer->setImageUrl("getchart.pl?img=/tmp/tmpcharts/".$chartQuery);
# Output Javascript chart model to the browser to support tracking cursor
$viewer->setChartModel($c->getJsChartModel());
}
#
# This script handles both the full page request, as well as the subsequent partial updates (AJAX
# chart updates). We need to determine the type of request first before we processing it.
#
# Create the WebChartViewer object
my $viewer = new WebChartViewer($query, "chart1");
if ($viewer->isPartialUpdateRequest()) {
# Is a partial update request. Draw the chart and perform a partial response.
drawChart($viewer);
print $viewer->partialUpdateChart();
exit 0;
}
#
# If the code reaches here, it is a full page request.
#
drawChart($viewer);
print "Content-type: text/html\n\n";
print <<EndOfHTML
<!DOCTYPE html>
<html>
<head>
<title>Realtime Chart with Track Line</title>
<script type="text/javascript" src="${loadResource}cdjcv.js"></script>
</head>
<body style="margin:0px">
<script type="text/javascript">
//
// Execute the following initialization code after the web page is loaded
//
JsChartViewer.addEventListener(window, 'load', function() {
var viewer = JsChartViewer.get('@{[$viewer->getId()]}');
// Draw track cursor when mouse is moving over plotarea or if the chart is updated. In the latter case,
// if the mouse is not on the plot area, we will update the legend to show the latest data values.
viewer.attachHandler(["MouseMovePlotArea", "TouchStartPlotArea", "TouchMovePlotArea", "ChartMove",
"PostUpdate", "Now"], function(e) {
this.preventDefault(e); // Prevent the browser from using touch events for other actions
trackLineLegend(viewer, viewer.getPlotAreaMouseX());
});
// When the chart is being updated, by default, an "Updating" box will pop up. In this example, we
// will disable this box.
viewer.updatingMsg = "";
});
//
// Draw track line with legend
//
function trackLineLegend(viewer, mouseX)
{
// Remove all previously drawn tracking object
viewer.hideObj("all");
// The chart and its plot area
var c = viewer.getChart();
var plotArea = c.getPlotArea();
// Get the data x-value that is nearest to the mouse, and find its pixel coordinate.
var xValue = c.getNearestXValue(mouseX);
var xCoor = c.getXCoor(xValue);
if (xCoor == null)
return;
// Draw a vertical track line at the x-position
viewer.drawVLine("trackLine", xCoor, plotArea.getTopY(), plotArea.getBottomY(), "black 1px dotted");
// Array to hold the legend entries
var legendEntries = [];
// Iterate through all layers to build the legend array
for (var i = 0; i < c.getLayerCount(); ++i)
{
var layer = c.getLayerByZ(i);
// The data array index of the x-value
var xIndex = layer.getXIndexOf(xValue);
// Iterate through all the data sets in the layer
for (var j = 0; j < layer.getDataSetCount(); ++j)
{
var dataSet = layer.getDataSetByZ(j);
// We are only interested in visible data sets with names, as they are required for legend entries.
var dataName = dataSet.getDataName();
var color = dataSet.getDataColor();
if ((!dataName) || (color == null))
continue;
// Build the legend entry, consist of a colored square box, the name and the data value.
var dataValue = dataSet.getValue(xIndex);
legendEntries.push("<nobr>" + viewer.htmlRect(7, 7, color) + " " + dataName + ": " +
((dataValue == null) ? "N/A" : dataValue.toPrecision(4)) + viewer.htmlRect(20, 0) + "</nobr> ");
// Draw a track dot for data points within the plot area
var yCoor = c.getYCoor(dataSet.getPosition(xIndex), dataSet.getUseYAxis());
if ((yCoor != null) && (yCoor >= plotArea.getTopY()) && (yCoor <= plotArea.getBottomY()))
{
viewer.showTextBox("dataPoint" + i + "_" + j, xCoor, yCoor, JsChartViewer.Center,
viewer.htmlRect(7, 7, color));
}
}
}
// Create the legend by joining the legend entries.
var legend = "<nobr>[" + c.xAxis().getFormattedLabel(xValue, "hh:nn:ss") + "]" + viewer.htmlRect(20, 0) +
"</nobr> " + legendEntries.reverse().join("");
// Display the legend on the top of the plot area
viewer.showTextBox("legend", plotArea.getLeftX(), plotArea.getTopY(), JsChartViewer.BottomLeft, legend,
"width:" + plotArea.getWidth() + "px;font:bold 11px Arial;padding:3px;-webkit-text-size-adjust:100%;");
}
//
// Executes once every second to update the countdown display. Updates the chart when the countdown reaches 0.
//
function timerTick()
{
// Get the update period and the time left
var updatePeriod = parseInt(document.getElementById("UpdatePeriod").value);
var timeLeft = Math.min(parseInt(document.getElementById("TimeRemaining").innerHTML), updatePeriod) - 1;
if (timeLeft == 0)
// Can update the chart now
JsChartViewer.get('@{[$viewer->getId()]}').partialUpdate();
else if (timeLeft < 0)
// Reset the update period
timeLeft += updatePeriod;
// Update the countdown display
document.getElementById("TimeRemaining").innerHTML = timeLeft;
}
window.setInterval("timerTick()", 1000);
</script>
<table cellspacing="0" cellpadding="0" border="0">
<tr>
<td align="right" colspan="2" style="background:#000088; color:#ffff00; padding:0px 4px 2px 0px;">
<a style="color:#FFFF00; font:italic bold 10pt Arial; text-decoration:none" href="http://www.advsofteng.com/">
Advanced Software Engineering
</a>
</td>
</tr>
<tr valign="top">
<td style="width:150px; background:#c0c0ff; border-right:black 1px solid; border-bottom:black 1px solid;">
<br />
<br />
<div style="font: 9pt Verdana; padding:10px;">
<b>Update Period</b><br />
<select id="UpdatePeriod" style="width:130px">
<option value="5">5</option>
<option value="10" selected="selected">10</option>
<option value="20">20</option>
<option value="30">30</option>
<option value="60">60</option>
</select>
</div>
<div style="font:9pt Verdana; padding:10px;">
<b>Time Remaining</b><br />
<div style="width:128px; border:#888888 1px inset;">
<div style="margin:3px" id="TimeRemaining">0</div>
</div>
</div>
</td>
<td>
<div style="font: bold 20pt Arial; margin:5px 0px 0px 5px;">
Realtime Chart with Track Line
</div>
<hr style="border:solid 1px #000080" />
<div style="padding:0px 5px 5px 10px">
<!-- ****** Here is the chart image ****** -->
@{[$viewer->renderHTML()]}
</div>
</td>
</tr>
</table>
</body>
</html>
EndOfHTML
; |