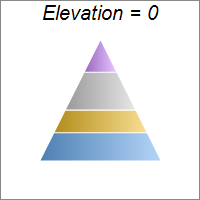
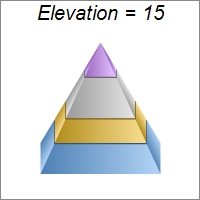
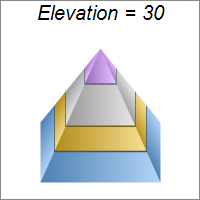
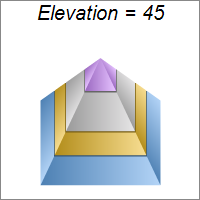
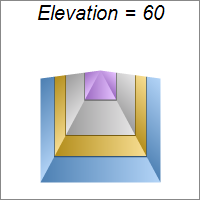
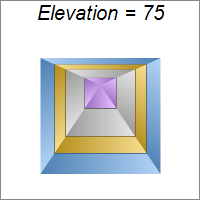
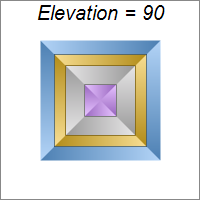
This example demonstrates viewing the pyramid at different elevation angles, configured with PyramidChart.setViewAngle.
ChartDirector 6.0 (Perl Edition)
Pyramid Elevation
Source Code Listing
#!/usr/bin/perl

# In the sample code, the ChartDirector for Perl module is assumed to be in "../lib"
use File::Basename;
use lib (dirname($0)."/../lib") =~ /(.*)/;

use perlchartdir;

sub createChart
{
    my $chartIndex = shift;

    # The data for the pyramid chart
    my $data = [156, 123, 211, 179];

    # The colors for the pyramid layers
    my $colors = [0x66aaee, 0xeebb22, 0xcccccc, 0xcc88ff];

    # The elevation angle
    my $angle = $chartIndex * 15;

    # Create a PyramidChart object of size 200 x 200 pixels, with white (ffffff) background and grey
    # (888888) border
    my $c = new PyramidChart(200, 200, 0xffffff, 0x888888);

    # Set the pyramid center at (100, 100), and width x height to 60 x 120 pixels
    $c->setPyramidSize(100, 100, 60, 120);

    # Set the elevation angle
    $c->addTitle("Elevation = $angle", "ariali.ttf", 15);
    $c->setViewAngle($angle);

    # Set the pyramid data
    $c->setData($data);

    # Set the layer colors to the given colors
    $c->setColors2($perlchartdir::DataColor, $colors);

    # Leave 1% gaps between layers
    $c->setLayerGap(0.01);

    # Output the chart
    $c->makeChart("pyramidelevation$chartIndex.png")
}

createChart(0);
createChart(1);
createChart(2);
createChart(3);
createChart(4);
createChart(5);
createChart(6); |
#!/usr/bin/perl

# In the sample code, the ChartDirector for Perl module is assumed to be in "../lib"
use File::Basename;
use lib (dirname($0)."/../lib") =~ /(.*)/;

use perlchartdir;

# Get HTTP query parameters
use CGI;
my $query = new CGI;

# This script can draw different charts depending on the chartIndex
$chartIndex = int($query->param("img"));

# The data for the pyramid chart
my $data = [156, 123, 211, 179];

# The colors for the pyramid layers
my $colors = [0x66aaee, 0xeebb22, 0xcccccc, 0xcc88ff];

# The elevation angle
my $angle = $chartIndex * 15;

# Create a PyramidChart object of size 200 x 200 pixels, with white (ffffff) background and grey
# (888888) border
my $c = new PyramidChart(200, 200, 0xffffff, 0x888888);

# Set the pyramid center at (100, 100), and width x height to 60 x 120 pixels
$c->setPyramidSize(100, 100, 60, 120);

# Set the elevation angle
$c->addTitle("Elevation = $angle", "ariali.ttf", 15);
$c->setViewAngle($angle);

# Set the pyramid data
$c->setData($data);

# Set the layer colors to the given colors
$c->setColors2($perlchartdir::DataColor, $colors);

# Leave 1% gaps between layers
$c->setLayerGap(0.01);

# Output the chart
binmode(STDOUT);
print "Content-type: image/png\n\n";
print $c->makeChart2($perlchartdir::PNG); |