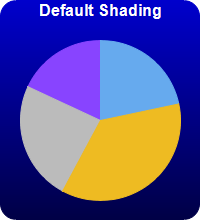
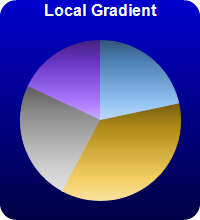
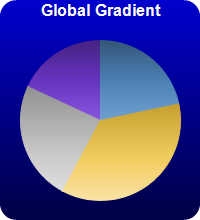

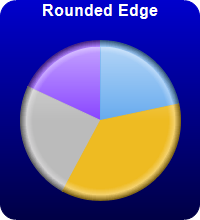
This example demonstrates various sector shading effects applicable to 2D pie charts.
ChartDirector 6.0 (Perl Edition)
2D Pie Shading
Source Code Listing
#!/usr/bin/perl
# In the sample code, the ChartDirector for Perl module is assumed to be in "../lib"
use File::Basename;
use lib (dirname($0)."/../lib") =~ /(.*)/;
use perlchartdir;
sub createChart
{
my $chartIndex = shift;
# The data for the pie chart
my $data = [18, 30, 20, 15];
# The colors to use for the sectors
my $colors = [0x66aaee, 0xeebb22, 0xbbbbbb, 0x8844ff];
# Create a PieChart object of size 200 x 220 pixels. Use a vertical gradient color from blue
# (0000cc) to deep blue (000044) as background. Use rounded corners of 16 pixels radius.
my $c = new PieChart(200, 220);
$c->setBackground($c->linearGradientColor(0, 0, 0, $c->getHeight(), 0x0000cc, 0x000044));
$c->setRoundedFrame(0xffffff, 16);
# Set the center of the pie at (100, 120) and the radius to 80 pixels
$c->setPieSize(100, 120, 80);
# Set the pie data
$c->setData($data);
# Set the sector colors
$c->setColors2($perlchartdir::DataColor, $colors);
# Demonstrates various shading modes
if ($chartIndex == 0) {
$c->addTitle("Default Shading", "bold", 12, 0xffffff);
} elsif ($chartIndex == 1) {
$c->addTitle("Local Gradient", "bold", 12, 0xffffff);
$c->setSectorStyle($perlchartdir::LocalGradientShading);
} elsif ($chartIndex == 2) {
$c->addTitle("Global Gradient", "bold", 12, 0xffffff);
$c->setSectorStyle($perlchartdir::GlobalGradientShading);
} elsif ($chartIndex == 3) {
$c->addTitle("Concave Shading", "bold", 12, 0xffffff);
$c->setSectorStyle($perlchartdir::ConcaveShading);
} elsif ($chartIndex == 4) {
$c->addTitle("Rounded Edge", "bold", 12, 0xffffff);
$c->setSectorStyle($perlchartdir::RoundedEdgeShading);
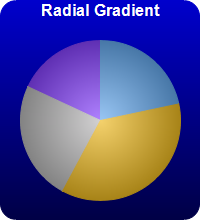
} elsif ($chartIndex == 5) {
$c->addTitle("Radial Gradient", "bold", 12, 0xffffff);
$c->setSectorStyle($perlchartdir::RadialShading);
}
# Disable the sector labels by setting the color to Transparent
$c->setLabelStyle("", 8, $perlchartdir::Transparent);
# Output the chart
$c->makeChart("pieshading$chartIndex.png")
}
createChart(0);
createChart(1);
createChart(2);
createChart(3);
createChart(4);
createChart(5); |
#!/usr/bin/perl

# In the sample code, the ChartDirector for Perl module is assumed to be in "../lib"
use File::Basename;
use lib (dirname($0)."/../lib") =~ /(.*)/;

use perlchartdir;

# Get HTTP query parameters
use CGI;
my $query = new CGI;

# This script can draw different charts depending on the chartIndex
$chartIndex = int($query->param("img"));

# The data for the pie chart
my $data = [18, 30, 20, 15];

# The colors to use for the sectors
my $colors = [0x66aaee, 0xeebb22, 0xbbbbbb, 0x8844ff];

# Create a PieChart object of size 200 x 220 pixels. Use a vertical gradient color from blue
# (0000cc) to deep blue (000044) as background. Use rounded corners of 16 pixels radius.
my $c = new PieChart(200, 220);
$c->setBackground($c->linearGradientColor(0, 0, 0, $c->getHeight(), 0x0000cc, 0x000044));
$c->setRoundedFrame(0xffffff, 16);

# Set the center of the pie at (100, 120) and the radius to 80 pixels
$c->setPieSize(100, 120, 80);

# Set the pie data
$c->setData($data);

# Set the sector colors
$c->setColors2($perlchartdir::DataColor, $colors);

# Demonstrates various shading modes
if ($chartIndex == 0) {
    $c->addTitle("Default Shading", "bold", 12, 0xffffff);
} elsif ($chartIndex == 1) {
    $c->addTitle("Local Gradient", "bold", 12, 0xffffff);
    $c->setSectorStyle($perlchartdir::LocalGradientShading);
} elsif ($chartIndex == 2) {
    $c->addTitle("Global Gradient", "bold", 12, 0xffffff);
    $c->setSectorStyle($perlchartdir::GlobalGradientShading);
} elsif ($chartIndex == 3) {
    $c->addTitle("Concave Shading", "bold", 12, 0xffffff);
    $c->setSectorStyle($perlchartdir::ConcaveShading);
} elsif ($chartIndex == 4) {
    $c->addTitle("Rounded Edge", "bold", 12, 0xffffff);
    $c->setSectorStyle($perlchartdir::RoundedEdgeShading);
} elsif ($chartIndex == 5) {
    $c->addTitle("Radial Gradient", "bold", 12, 0xffffff);
    $c->setSectorStyle($perlchartdir::RadialShading);
}

# Disable the sector labels by setting the color to Transparent
$c->setLabelStyle("", 8, $perlchartdir::Transparent);

# Output the chart
binmode(STDOUT);
print "Content-type: image/png\n\n";
print $c->makeChart2($perlchartdir::PNG); |