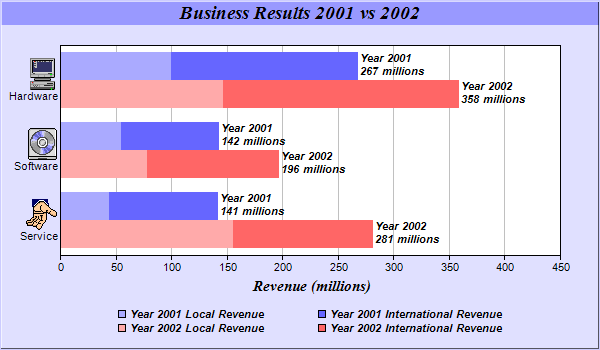
This example demonstrates combining multi-bar style with stacked bar style. It also demonstrates drawing horizontal bar charts, using icons in axis labels with CDML, customizing legend and bar labels, controlling bar widths and centering legend box.
A multi-stacked bar chart combines the multi-bar style with the stacked bar style by allowing each bar in a multi-bar chart to be a stacked bar. This provides two levels of data grouping. The data from the data sets are clusters based on their index position. Within each cluster, the data are grouped again to form stack bars.
The standard multi-bar chart provides the first level of grouping. The Layer.addDataGroup method is used to provide the second level of grouping.
The key features demonstrated in this example are:
- Use Layer.addDataGroup to start a new data group. All subsequent data sets added to the layer will belong to that group. The group ends when Layer.addDataGroup is called again to start another new group.
- Embed icons in axis labels by using CDML to encode the labels.
- Set the bar border to Transparent using Layer.setBorderColor.
- Set a 20% bar gap between the bar clusters and 0% (no gap) for bars within a bar cluster by using BarLayer.setBarGap.
- Swap the x and y axes to create a horizontal bar chart using XYChart.swapXY.
- Reserve 20% space at the right side of the plot area for the bar labels by using Axis.setAutoScale.
- Customize the aggregate bar labels by using Layer.setAggregateLabelFormat.
- Customize the legend entries by using TextBox.setText of the LegendBox object.
- Center the legend box under the plot area by using TextBox.setAlignment of the LegendBox object.