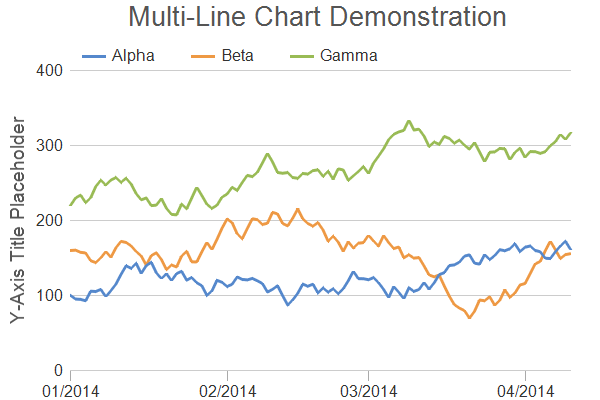
This example demonstrates a chart with multiple lines using date/time x coordinates for the data points (as opposed to using x-axis labels). It also demonstrates various methods to control the chart appearance.
In ChartDirector, x coordinates for the data points are optional. If no x coordinates are provided for the data points, the x coordinates will be assumed to be the array indexes (0, 1, 2, 3 ...), and the data points would be evenly spaced in the x direction. Axis labels specified using Axis.setLabels or Axis.setLabels2 are also positioned using the array indexes as the x coordinates, so the labels will match with the data points.
In some applications, it may be necessary or more convenient to provide x coordinates for the data points. For example, if the data points are unevenly spaced, or if there are multiple data series with different data point spacing in the x direction, x coordinates are needed. In this case, Layer.setXData or Layer.setXData2 can be used to provide the x coordinates. By default, ChartDirector will then automatically determine the x-axis scale and labels, just like how the y-axis is handled. The axis scale and labels can also be specified by using various Axis methods, such as Axis.setLinearScale, Axis.setLogScale and Axis.setDateScale (please refer to Axis for the full list).
Axis.setLabels or Axis.setLabels2 should not be used if x coordinates are provided, as they use array indexes as the x coordinates, which is unlikely to be consistent with the provided x coordinates.
In this example, x coordinates are used to demonstrate the automatic x-axis scale and labels.