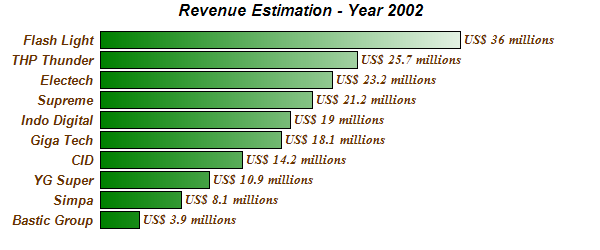
This example demonstrates a horizontal bar chart with no axes, grid lines or and plot area border. It also demonstrates using gradient colors for the bars, and a number of other ChartDirector features.
The key features demonstrated in this example are:
- Swap the x and y axes to create a horizontal bar chart using XYChart.swapXY.
- Create a gradient color that changes smoothly from dark green to white along a horizontal direction using BaseChart.gradientColor, then use it as the bar color in XYChart.addBarLayer.
- Set the plot area background, border and grid line colors to Transparent using XYChart.setPlotArea.
- Set the x-axis, y-axis and y-axis labels to Transparent using Axis.setColors.
- Set the x-axis font style to deep red 10 points Arial Bold Italic by using the TextBox.setFontStyle and TextBox.setFontColor of the TextBox object that represents the x-axis label prototype (obtained using Axis.setLabels).
- Set the aggregate bar label style to deep red 10 points Times Bold Italic using Layer.setAggregateLabelStyle.
- Customize the aggregate bar labels by using Layer.setAggregateLabelFormat.