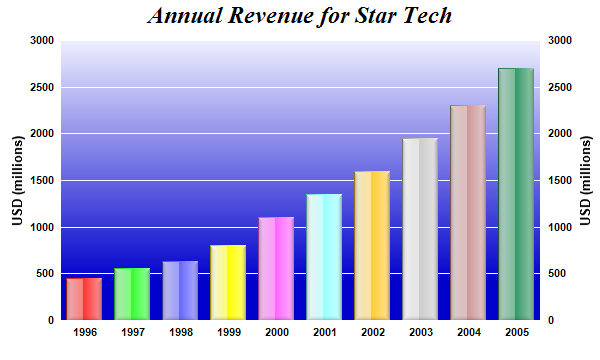
This example demonstrates using glass shading effect for bars and gradient color for plot area background. It also demonstrates axis labels on both sides of the plot area.
Glass lighting is a complex shading effect that gives a look and feel of tinted glass or semi-transparent plastic material. This effect involves glare and variation of lighting caused by reflection and refraction inside the material.
- The gradient plot area background is configured by using BaseChart.linearGradientColor to define the gradient color, then use XYChart.setPlotArea to apply it to the plot area.
- The XYChart.setPlotArea also sets the plot area border and grid line colors to white.
- The glass shading effect of the bars is defined using perlchartdir::glassEffect, then applied to the bars using Layer.setBorderColor.
- XYChart.syncYAxis is used to show two synchronized y-axes on both sides of the plot area.
- Axis.setColors is used to set the y-axes to Transparent, so only the axis labels are visible.
- The axis label font is set to Arial Bold using Axis.setLabelStyle.