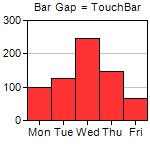
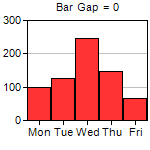

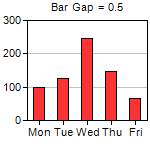
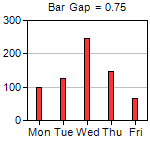
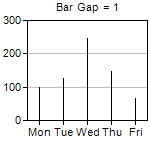
This example demonstrates the effects of different bar gaps configured using BarLayer.setBarGap.
ChartDirector 6.0 (Perl Edition)
Bar Gap
Source Code Listing
#!/usr/bin/perl

# In the sample code, the ChartDirector for Perl module is assumed to be in "../lib"
use File::Basename;
use lib (dirname($0)."/../lib") =~ /(.*)/;

use perlchartdir;

sub createChart
{
    my $chartIndex = shift;

    my $bargap = $chartIndex * 0.25 - 0.25;

    # The data for the bar chart
    my $data = [100, 125, 245, 147, 67];

    # The labels for the bar chart
    my $labels = ["Mon", "Tue", "Wed", "Thu", "Fri"];

    # Create a XYChart object of size 150 x 150 pixels
    my $c = new XYChart(150, 150);

    # Set the plotarea at (27, 20) and of size 120 x 100 pixels
    $c->setPlotArea(27, 20, 120, 100);

    # Set the labels on the x axis
    $c->xAxis()->setLabels($labels);

    if ($bargap >= 0) {
        # Add a title to display to bar gap using 8pt Arial font
        $c->addTitle("      Bar Gap = $bargap", "arial.ttf", 8);
    } else {
        # Use negative value to mean TouchBar
        $c->addTitle("      Bar Gap = TouchBar", "arial.ttf", 8);
        $bargap = $perlchartdir::TouchBar;
    }

    # Add a bar chart layer using the given data and set the bar gap
    $c->addBarLayer($data)->setBarGap($bargap);

    # Output the chart
    $c->makeChart("gapbar$chartIndex.png")
}

createChart(0);
createChart(1);
createChart(2);
createChart(3);
createChart(4);
createChart(5); |
#!/usr/bin/perl

# In the sample code, the ChartDirector for Perl module is assumed to be in "../lib"
use File::Basename;
use lib (dirname($0)."/../lib") =~ /(.*)/;

use perlchartdir;

# Get HTTP query parameters
use CGI;
my $query = new CGI;

# This script can draw different charts depending on the chartIndex
$chartIndex = int($query->param("img"));

my $bargap = $chartIndex * 0.25 - 0.25;

# The data for the bar chart
my $data = [100, 125, 245, 147, 67];

# The labels for the bar chart
my $labels = ["Mon", "Tue", "Wed", "Thu", "Fri"];

# Create a XYChart object of size 150 x 150 pixels
my $c = new XYChart(150, 150);

# Set the plotarea at (27, 20) and of size 120 x 100 pixels
$c->setPlotArea(27, 20, 120, 100);

# Set the labels on the x axis
$c->xAxis()->setLabels($labels);

if ($bargap >= 0) {
    # Add a title to display to bar gap using 8pt Arial font
    $c->addTitle("      Bar Gap = $bargap", "arial.ttf", 8);
} else {
    # Use negative value to mean TouchBar
    $c->addTitle("      Bar Gap = TouchBar", "arial.ttf", 8);
    $bargap = $perlchartdir::TouchBar;
}

# Add a bar chart layer using the given data and set the bar gap
$c->addBarLayer($data)->setBarGap($bargap);

# Output the chart
binmode(STDOUT);
print "Content-type: image/png\n\n";
print $c->makeChart2($perlchartdir::PNG); |