ChartDirector 6.0 (Perl Edition)

Text Styles and Colors (2)


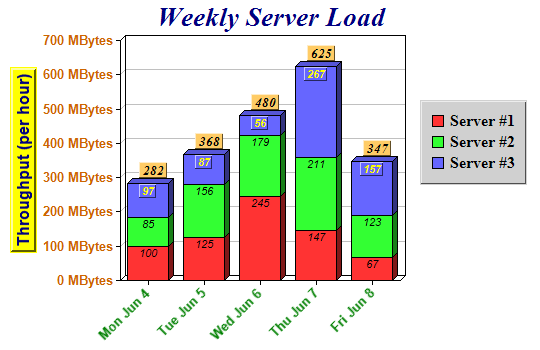
This example demonstrates controlling text style and colors in various text containing objects (chart and axis titles, axis labels, legend keys, data labels, etc).

The chart title, y-axis title, y-axis labels, x-axis labels, legend keys, and the data labels are configured with different fonts and colors, and have different background and 3D border effects. The y-axis labels are appended with "Mbytes" as the unit. The x-axis labels are rotated 45 degrees.

Note that since ChartDirector Ver 3.0, you may use CDML to produce more sophisticated formatting effects than demonstrated in this example.

Source Code Listing

[Standalone Version] perldemo\fontxy.pl
#!/usr/bin/perl

# In the sample code, the ChartDirector for Perl module is assumed to be in "../lib"
use File::Basename;
use lib (dirname($0)."/../lib") =~ /(.*)/;

use perlchartdir;

# The data for the chart
my $data0 = [100, 125, 245, 147, 67];
my $data1 = [85, 156, 179, 211, 123];
my $data2 = [97, 87, 56, 267, 157];
my $labels = ["Mon Jun 4", "Tue Jun 5", "Wed Jun 6", "Thu Jun 7", "Fri Jun 8"];

# Create a XYChart object of size 540 x 350 pixels
my $c = new XYChart(540, 350);

# Set the plot area to start at (120, 40) and of size 280 x 240 pixels
$c->setPlotArea(120, 40, 280, 240);

# Add a title to the chart using 20pt Times Bold Italic (timesbi.ttf) font and using a deep blue
# color (0x000080)
$c->addTitle("Weekly Server Load", "timesbi.ttf", 20, 0x000080);

# Add a legend box at (420, 100) (right of plot area) using 12pt Times Bold font. Sets the
# background of the legend box to light grey 0xd0d0d0 with a 1 pixel 3D border.
$c->addLegend(420, 100, 1, "timesbd.ttf", 12)->setBackground(0xd0d0d0, 0xd0d0d0, 1);

# Add a title to the y-axis using 12pt Arial Bold/deep blue (0x000080) font. Set the background to
# yellow (0xffff00) with a 2 pixel 3D border.
$c->yAxis()->setTitle("Throughput (per hour)", "arialbd.ttf", 12, 0x000080)->setBackground(0xffff00,
    0xffff00, 2);

# Use 10pt Arial Bold/orange (0xcc6600) font for the y axis labels
$c->yAxis()->setLabelStyle("arialbd.ttf", 10, 0xcc6600);

# Set the axis label format to "nnn MBytes"
$c->yAxis()->setLabelFormat("{value} MBytes");

# Use 10pt Arial Bold/green (0x008000) font for the x axis labels. Set the label angle to 45
# degrees.
$c->xAxis()->setLabelStyle("arialbd.ttf", 10, 0x008000)->setFontAngle(45);

# Set the labels on the x axis.
$c->xAxis()->setLabels($labels);

# Add a 3D stack bar layer with a 3D depth of 5 pixels
my $layer = $c->addBarLayer2($perlchartdir::Stack, 5);

# Use Arial Italic as the default data label font in the bars
$layer->setDataLabelStyle("ariali.ttf");

# Use 10pt Times Bold Italic (timesbi.ttf) as the aggregate label font. Set the background to flesh
# (0xffcc66) color with a 1 pixel 3D border.
$layer->setAggregateLabelStyle("timesbi.ttf", 10)->setBackground(0xffcc66,
    $perlchartdir::Transparent, 1);

# Add the first data set to the stacked bar layer
$layer->addDataSet($data0, -1, "Server #1");

# Add the second data set to the stacked bar layer
$layer->addDataSet($data1, -1, "Server #2");

# Add the third data set to the stacked bar layer, and set its data label font to Arial Bold Italic.
my $textbox = $layer->addDataSet($data2, -1, "Server #3")->setDataLabelStyle("arialbi.ttf");

# Set the data label font color for the third data set to yellow (0xffff00)
$textbox->setFontColor(0xffff00);

# Set the data label background color to the same color as the bar segment, with a 1 pixel 3D
# border.
$textbox->setBackground($perlchartdir::SameAsMainColor, $perlchartdir::Transparent, 1);

# Output the chart
$c->makeChart("fontxy.png")

[CGI Version] perldemo_cgi\fontxy.pl
#!/usr/bin/perl

# In the sample code, the ChartDirector for Perl module is assumed to be in "../lib"
use File::Basename;
use lib (dirname($0)."/../lib") =~ /(.*)/;

use perlchartdir;

# The data for the chart
my $data0 = [100, 125, 245, 147, 67];
my $data1 = [85, 156, 179, 211, 123];
my $data2 = [97, 87, 56, 267, 157];
my $labels = ["Mon Jun 4", "Tue Jun 5", "Wed Jun 6", "Thu Jun 7", "Fri Jun 8"];

# Create a XYChart object of size 540 x 350 pixels
my $c = new XYChart(540, 350);

# Set the plot area to start at (120, 40) and of size 280 x 240 pixels
$c->setPlotArea(120, 40, 280, 240);

# Add a title to the chart using 20pt Times Bold Italic (timesbi.ttf) font and using a deep blue
# color (0x000080)
$c->addTitle("Weekly Server Load", "timesbi.ttf", 20, 0x000080);

# Add a legend box at (420, 100) (right of plot area) using 12pt Times Bold font. Sets the
# background of the legend box to light grey 0xd0d0d0 with a 1 pixel 3D border.
$c->addLegend(420, 100, 1, "timesbd.ttf", 12)->setBackground(0xd0d0d0, 0xd0d0d0, 1);

# Add a title to the y-axis using 12pt Arial Bold/deep blue (0x000080) font. Set the background to
# yellow (0xffff00) with a 2 pixel 3D border.
$c->yAxis()->setTitle("Throughput (per hour)", "arialbd.ttf", 12, 0x000080)->setBackground(0xffff00,
    0xffff00, 2);

# Use 10pt Arial Bold/orange (0xcc6600) font for the y axis labels
$c->yAxis()->setLabelStyle("arialbd.ttf", 10, 0xcc6600);

# Set the axis label format to "nnn MBytes"
$c->yAxis()->setLabelFormat("{value} MBytes");

# Use 10pt Arial Bold/green (0x008000) font for the x axis labels. Set the label angle to 45
# degrees.
$c->xAxis()->setLabelStyle("arialbd.ttf", 10, 0x008000)->setFontAngle(45);

# Set the labels on the x axis.
$c->xAxis()->setLabels($labels);

# Add a 3D stack bar layer with a 3D depth of 5 pixels
my $layer = $c->addBarLayer2($perlchartdir::Stack, 5);

# Use Arial Italic as the default data label font in the bars
$layer->setDataLabelStyle("ariali.ttf");

# Use 10pt Times Bold Italic (timesbi.ttf) as the aggregate label font. Set the background to flesh
# (0xffcc66) color with a 1 pixel 3D border.
$layer->setAggregateLabelStyle("timesbi.ttf", 10)->setBackground(0xffcc66,
    $perlchartdir::Transparent, 1);

# Add the first data set to the stacked bar layer
$layer->addDataSet($data0, -1, "Server #1");

# Add the second data set to the stacked bar layer
$layer->addDataSet($data1, -1, "Server #2");

# Add the third data set to the stacked bar layer, and set its data label font to Arial Bold Italic.
my $textbox = $layer->addDataSet($data2, -1, "Server #3")->setDataLabelStyle("arialbi.ttf");

# Set the data label font color for the third data set to yellow (0xffff00)
$textbox->setFontColor(0xffff00);

# Set the data label background color to the same color as the bar segment, with a 1 pixel 3D
# border.
$textbox->setBackground($perlchartdir::SameAsMainColor, $perlchartdir::Transparent, 1);

# Output the chart
binmode(STDOUT);
print "Content-type: image/png\n\n";
print $c->makeChart2($perlchartdir::PNG);