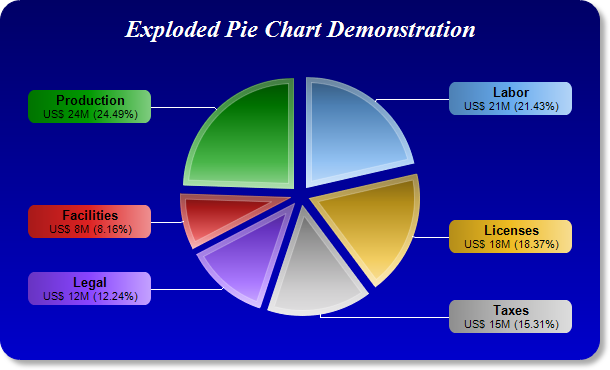
This example demonstrates a pie chart with all sectors exploded. It also demonstrates many effects, such as gradient color background, rounded frame, soft drop shadow, custom sector colors, sector gradient shading, thick sector border, and using CDML and Parameter Substitution and Formatting to format sector labels.
- The gradient background is achieved by using BaseChart.linearGradientColor to define the gradient color, then use BaseChart.setBackground to set it as the chart background color.
- The rounded frame is configured using BaseChart.setRoundedFrame.
- The soft drop shadow is configured using BaseChart.setDropShadow.
- The sector colors are set using BaseChart.setColors. The sector gradient shading and thick sector border is configured using PieChart.setSectorStyle.
- The sector label style are configured using PieChart.setLabelStyle. It returns a TextBox object representing the sector label prototype. The gradient background color and rounded corners of the sector labels are configured using the Box.setBackground and Box.setRoundedCorners methods of the label prototype.
- The sector label contents are configured using PieChart.setLabelFormat. The template is specified using CDML and Parameter Substitution and Formatting. It consists of two lines using different fonts. This first line shows the sector label, while the second line shows the sector value and percentage.