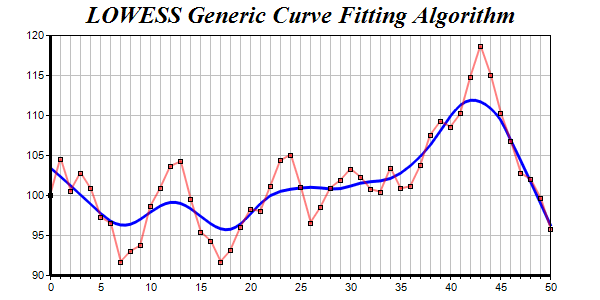
This example demonstrates the LOWESS general purpose curve fitting that is built into ChartDirector.
In regression curve fitting, a function type have to be chosen first, and the data are used to compute the best parameters of that function. For example, in polynomial regression, the function type is a polynomial of a given degree, and the data are used to determine the optimal polynomial coefficients.
However, in many applications, the function type is not known or not expressible in algebraic form. To handle these cases, ChartDirector supports a general curve fitting algorithm known as LOWESS. For details, please refer to
ArrayMath.lowess and
ArrayMath.lowess2.
The LOWESS algorithm only adjusts the points to smoothen them. They still need to be joined together. In this example, the adjusted points are joined with a spline layer using
XYChart.addSplineLayer.
[Standalone Version] perldemo\curvefitting.pl
#!/usr/bin/perl

# In the sample code, the ChartDirector for Perl module is assumed to be in "../lib"
use File::Basename;
use lib (dirname($0)."/../lib") =~ /(.*)/;

use perlchartdir;

# Use random table to generate a random series. The random table is set to 1 col x 51 rows, with 9
# as the seed
my $rantable = new RanTable(9, 1, 51);

# Set the 1st column to start from 100, with changes between rows from -5 to +5
$rantable->setCol(0, 100, -5, 5);

# Get the 1st column of the random table as the data set
my $data = $rantable->getCol(0);

# Create a XYChart object of size 600 x 300 pixels
my $c = new XYChart(600, 300);

# Set the plotarea at (50, 35) and of size 500 x 240 pixels. Enable both the horizontal and vertical
# grids by setting their colors to grey (0xc0c0c0)
$c->setPlotArea(50, 35, 500, 240)->setGridColor(0xc0c0c0, 0xc0c0c0);

# Add a title to the chart using 18 point Times Bold Itatic font.
$c->addTitle("LOWESS Generic Curve Fitting Algorithm", "timesbi.ttf", 18);

# Set the y axis line width to 3 pixels
$c->yAxis()->setWidth(3);

# Add a title to the x axis using 12pt Arial Bold Italic font
$c->xAxis()->setTitle("Server Load (TPS)", "arialbi.ttf", 12);

# Set the x axis line width to 3 pixels
$c->xAxis()->setWidth(3);

# Set the x axis scale from 0 - 50, with major tick every 5 units and minor tick every 1 unit
$c->xAxis()->setLinearScale(0, 50, 5, 1);

# Add a blue layer to the chart
my $layer = $c->addLineLayer2();

# Add a red (0x80ff0000) data set to the chart with square symbols
$layer->addDataSet($data, 0x80ff0000)->setDataSymbol($perlchartdir::SquareSymbol);

# Set the line width to 2 pixels
$layer->setLineWidth(2);

# Use lowess for curve fitting, and plot the fitted data using a spline layer with line width set to
# 3 pixels
$c->addSplineLayer(new ArrayMath($data)->lowess()->result(), 0x0000ff)->setLineWidth(3);

# Set zero affinity to 0 to make sure the line is displayed in the most detail scale
$c->yAxis()->setAutoScale(0, 0, 0);

# Output the chart
$c->makeChart("curvefitting.png") |
[CGI Version] perldemo_cgi\curvefitting.pl
#!/usr/bin/perl

# In the sample code, the ChartDirector for Perl module is assumed to be in "../lib"
use File::Basename;
use lib (dirname($0)."/../lib") =~ /(.*)/;

use perlchartdir;

# Use random table to generate a random series. The random table is set to 1 col x 51 rows, with 9
# as the seed
my $rantable = new RanTable(9, 1, 51);

# Set the 1st column to start from 100, with changes between rows from -5 to +5
$rantable->setCol(0, 100, -5, 5);

# Get the 1st column of the random table as the data set
my $data = $rantable->getCol(0);

# Create a XYChart object of size 600 x 300 pixels
my $c = new XYChart(600, 300);

# Set the plotarea at (50, 35) and of size 500 x 240 pixels. Enable both the horizontal and vertical
# grids by setting their colors to grey (0xc0c0c0)
$c->setPlotArea(50, 35, 500, 240)->setGridColor(0xc0c0c0, 0xc0c0c0);

# Add a title to the chart using 18 point Times Bold Itatic font.
$c->addTitle("LOWESS Generic Curve Fitting Algorithm", "timesbi.ttf", 18);

# Set the y axis line width to 3 pixels
$c->yAxis()->setWidth(3);

# Add a title to the x axis using 12pt Arial Bold Italic font
$c->xAxis()->setTitle("Server Load (TPS)", "arialbi.ttf", 12);

# Set the x axis line width to 3 pixels
$c->xAxis()->setWidth(3);

# Set the x axis scale from 0 - 50, with major tick every 5 units and minor tick every 1 unit
$c->xAxis()->setLinearScale(0, 50, 5, 1);

# Add a blue layer to the chart
my $layer = $c->addLineLayer2();

# Add a red (0x80ff0000) data set to the chart with square symbols
$layer->addDataSet($data, 0x80ff0000)->setDataSymbol($perlchartdir::SquareSymbol);

# Set the line width to 2 pixels
$layer->setLineWidth(2);

# Use lowess for curve fitting, and plot the fitted data using a spline layer with line width set to
# 3 pixels
$c->addSplineLayer(new ArrayMath($data)->lowess()->result(), 0x0000ff)->setLineWidth(3);

# Set zero affinity to 0 to make sure the line is displayed in the most detail scale
$c->yAxis()->setAutoScale(0, 0, 0);

# Output the chart
binmode(STDOUT);
print "Content-type: image/png\n\n";
print $c->makeChart2($perlchartdir::PNG); |
© 2017 Advanced Software Engineering Limited. All rights reserved.
