<?php
require_once("../lib/phpchartdir.php");
# Data for the chart as 3 random data series
$r = new RanSeries(127);
$data0 = $r->getSeries(100, 100, -15, 15);
$data1 = $r->getSeries(100, 150, -15, 15);
$data2 = $r->getSeries(100, 200, -15, 15);
$timeStamps = $r->getDateSeries(100, chartTime(2011, 1, 1), 86400);
# Create a XYChart object of size 640 x 400 pixels
$c = new XYChart(640, 400);
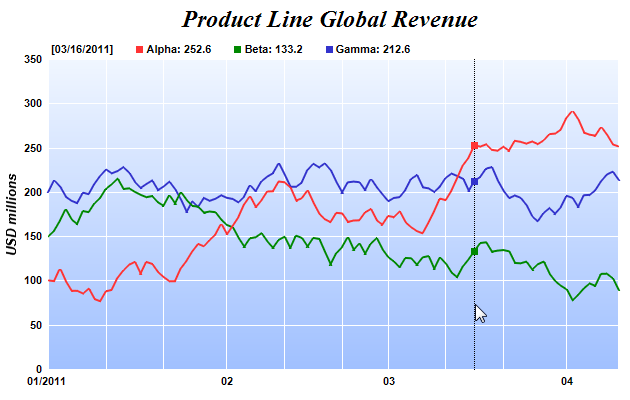
# Add a title to the chart using 18 pts Times New Roman Bold Italic font
$c->addTitle(" Product Line Global Revenue", "timesbi.ttf", 18);
# Set the plotarea at (50, 55) with width 70 pixels less than chart width, and height 90 pixels less
# than chart height. Use a vertical gradient from light blue (f0f6ff) to sky blue (a0c0ff) as
# background. Set border to transparent and grid lines to white (ffffff).
$c->setPlotArea(50, 55, $c->getWidth() - 70, $c->getHeight() - 90, $c->linearGradientColor(0, 55, 0,
$c->getHeight() - 35, 0xf0f6ff, 0xa0c0ff), -1, Transparent, 0xffffff, 0xffffff);
# Set axis label style to 8pts Arial Bold
$c->xAxis->setLabelStyle("arialbd.ttf", 8);
$c->yAxis->setLabelStyle("arialbd.ttf", 8);
# Set the axis stem to transparent
$c->xAxis->setColors(Transparent);
$c->yAxis->setColors(Transparent);
# Configure x-axis label format
$c->xAxis->setMultiFormat(StartOfYearFilter(), "{value|mm/yyyy} ", StartOfMonthFilter(),
"{value|mm}");
# Add axis title using 10pts Arial Bold Italic font
$c->yAxis->setTitle("USD millions", "arialbi.ttf", 10);
# Add a line layer to the chart using a line width of 2 pixels.
$layer = $c->addLineLayer2();
$layer->setLineWidth(2);
# Add 3 data series to the line layer
$layer->setXData($timeStamps);
$layer->addDataSet($data0, 0xff3333, "Alpha");
$layer->addDataSet($data1, 0x008800, "Beta");
$layer->addDataSet($data2, 0x3333cc, "Gamma");
# Create the WebChartViewer object
$viewer = new WebChartViewer("chart1");
# Output the chart
$chartQuery = $c->makeSession($viewer->getId());
# Set the chart URL to the viewer
$viewer->setImageUrl("getchart.php?".$chartQuery);
# Output Javascript chart model to the browser to support tracking cursor
$viewer->setChartModel($c->getJsChartModel());
?>
<!DOCTYPE html PUBLIC "-//W3C//DTD XHTML 1.0 Transitional//EN" "http://www.w3.org/TR/xhtml1/DTD/xhtml1-transitional.dtd">
<html>
<head>
<title>Track Line with Legend</title>
<script type="text/javascript" src="cdjcv.js"></script>
</head>
<body style="margin:5px 0px 0px 5px">
<script type="text/javascript">
//
// Use the window load event to set up the MouseMovePlotArea event handler
//
JsChartViewer.addEventListener(window, 'load', function() {
var viewer = JsChartViewer.get('<?php echo $viewer->getId()?>');
// Draw track cursor when mouse is moving over plotarea
viewer.attachHandler("MouseMovePlotArea", function(e) {
trackLineLegend(viewer, viewer.getPlotAreaMouseX());
});
// Initialize the track legend to show the rightmost data point
trackLineLegend(viewer, viewer.getChart().getPlotArea().getRightX());
});
//
// Draw track line with legend
//
function trackLineLegend(viewer, mouseX)
{
// Remove all previously drawn tracking object
viewer.hideObj("all");
// The chart and its plot area
var c = viewer.getChart();
var plotArea = c.getPlotArea();
// Get the data x-value that is nearest to the mouse, and find its pixel coordinate.
var xValue = c.getNearestXValue(mouseX);
var xCoor = c.getXCoor(xValue);
if (xCoor == null)
return;
// Draw a vertical track line at the x-position
viewer.drawVLine("trackLine", xCoor, plotArea.getTopY(), plotArea.getBottomY(), "black 1px dotted");
// Array to hold the legend entries
var legendEntries = [];
// Iterate through all layers to build the legend array
for (var i = 0; i < c.getLayerCount(); ++i)
{
var layer = c.getLayerByZ(i);
// The data array index of the x-value
var xIndex = layer.getXIndexOf(xValue);
// Iterate through all the data sets in the layer
for (var j = 0; j < layer.getDataSetCount(); ++j)
{
var dataSet = layer.getDataSetByZ(j);
// We are only interested in visible data sets with names, as they are required for legend entries.
var dataName = dataSet.getDataName();
var color = dataSet.getDataColor();
if ((!dataName) || (color == null))
continue;
// Build the legend entry, consist of a colored square box, the name and the data value.
var dataValue = dataSet.getValue(xIndex);
legendEntries.push("<nobr>" + viewer.htmlRect(7, 7, color) + " " + dataName + ": " +
((dataValue == null) ? "N/A" : dataValue.toPrecision(4)) + viewer.htmlRect(20, 0) + "</nobr> ");
// Draw a track dot for data points within the plot area
var yCoor = c.getYCoor(dataSet.getPosition(xIndex), dataSet.getUseYAxis());
if ((yCoor != null) && (yCoor >= plotArea.getTopY()) && (yCoor <= plotArea.getBottomY()))
{
viewer.showTextBox("dataPoint" + i + "_" + j, xCoor, yCoor, JsChartViewer.Center,
viewer.htmlRect(7, 7, color));
}
}
}
// Create the legend by joining the legend entries.
var legend = "<nobr>[" + c.xAxis().getFormattedLabel(xValue, "mm/dd/yyyy") + "]" + viewer.htmlRect(20, 0) +
"</nobr> " + legendEntries.reverse().join("");
// Display the legend on the top of the plot area
viewer.showTextBox("legend", plotArea.getLeftX(), plotArea.getTopY(), JsChartViewer.BottomLeft, legend,
"width:" + (plotArea.getWidth() - 1) + "px;font:bold 11px Arial;padding:3px;");
}
</script>
<div style="font-size:18pt; font-family:verdana; font-weight:bold">
Track Line with Legend
</div>
<hr style="border:solid 1px #000080" />
<div style="font-size:10pt; font-family:verdana; margin-bottom:1.5em">
<a href="viewsource.php?file=<?php echo $_SERVER["SCRIPT_NAME"]?>">View Source Code</a>
</div>
<!-- ****** Here is the chart image ****** -->
<?php echo $viewer->renderHTML()?>
</body>
</html> |