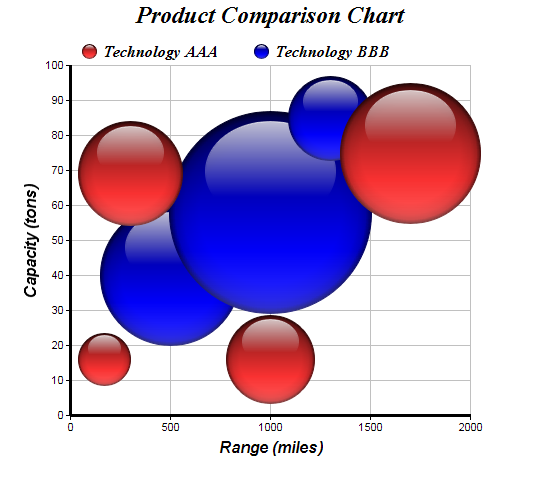
This examples demonstrates a bubble chart using brighter glass spheres as bubbles.
ChartDirector 5.1 (PHP Edition)
3D Bubble Chart (2)
Source Code Listing
<?php
require_once("../lib/phpchartdir.php");

# The XYZ points for the bubble chart
$dataX0 = array(170, 300, 1000, 1700);
$dataY0 = array(16, 69, 16, 75);
$dataZ0 = array(52, 105, 88, 140);

$dataX1 = array(500, 1000, 1300);
$dataY1 = array(40, 58, 85);
$dataZ1 = array(140, 202, 84);

# Create a XYChart object of size 540 x 480 pixels
$c = new XYChart(540, 480);

# Set the plotarea at (70, 65) and of size 400 x 350 pixels. Turn on both horizontal
# and vertical grid lines with light grey color (0xc0c0c0)
$c->setPlotArea(70, 65, 400, 350, -1, -1, Transparent, 0xc0c0c0, -1);

# Add a legend box at (70, 30) (top of the chart) with horizontal layout. Use 12 pts
# Times Bold Italic font. Set the background and border color to Transparent.
$legendObj = $c->addLegend(70, 30, false, "timesbi.ttf", 12);
$legendObj->setBackground(Transparent);

# Add a title to the chart using 18 pts Times Bold Itatic font.
$c->addTitle("Product Comparison Chart", "timesbi.ttf", 18);

# Add titles to the axes using 12 pts Arial Bold Italic font
$c->yAxis->setTitle("Capacity (tons)", "arialbi.ttf", 12);
$c->xAxis->setTitle("Range (miles)", "arialbi.ttf", 12);

# Set the axes line width to 3 pixels
$c->xAxis->setWidth(3);
$c->yAxis->setWidth(3);

# Add (dataX0, dataY0) as a scatter layer with red (ff3333) glass spheres, where the
# sphere size is modulated by dataZ0. This creates a bubble effect.
$scatterLayerObj = $c->addScatterLayer($dataX0, $dataY0, "Technology AAA",
    GlassSphere2Shape, 15, 0xff3333);
$scatterLayerObj->setSymbolScale($dataZ0);

# Add (dataX1, dataY1) as a scatter layer with blue (0000ff) glass spheres, where the
# sphere size is modulated by dataZ1. This creates a bubble effect.
$scatterLayerObj = $c->addScatterLayer($dataX1, $dataY1, "Technology BBB",
    GlassSphere2Shape, 15, 0x0000ff);
$scatterLayerObj->setSymbolScale($dataZ1);

# Output the chart
header("Content-type: image/png");
print($c->makeChart2(PNG));
?> |