<%@ Page Language="VB" Debug="true" %>
<%@ Import Namespace="ChartDirector" %>
<%@ Register TagPrefix="chart" Namespace="ChartDirector" Assembly="netchartdir" %>
<script runat="server">
'
' Page Load event handler
'
Protected Sub Page_Load(ByVal sender As System.Object, ByVal e As System.EventArgs)
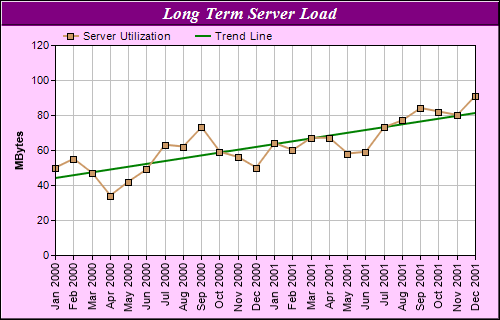
' The data for the line chart
Dim data() As Double = {50, 55, 47, 34, 42, 49, 63, 62, 73, 59, 56, 50, 64, 60, _
67, 67, 58, 59, 73, 77, 84, 82, 80, 91}
' The labels for the line chart
Dim labels() As String = {"Jan 2000", "Feb 2000", "Mar 2000", "Apr 2000", _
"May 2000", "Jun 2000", "Jul 2000", "Aug 2000", "Sep 2000", "Oct 2000", _
"Nov 2000", "Dec 2000", "Jan 2001", "Feb 2001", "Mar 2001", "Apr 2001", _
"May 2001", "Jun 2001", "Jul 2001", "Aug 2001", "Sep 2001", "Oct 2001", _
"Nov 2001", "Dec 2001"}
' Create a XYChart object of size 500 x 320 pixels, with a pale purpule
' (0xffccff) background, a black border, and 1 pixel 3D border effect.
Dim c As XYChart = New XYChart(500, 320, &Hffccff, &H000000, 1)
' Set the plotarea at (55, 45) and of size 420 x 210 pixels, with white
' background. Turn on both horizontal and vertical grid lines with light grey
' color (0xc0c0c0)
c.setPlotArea(55, 45, 420, 210, &Hffffff, -1, -1, &Hc0c0c0, -1)
' Add a legend box at (55, 25) (top of the chart) with horizontal layout. Use 8
' pts Arial font. Set the background and border color to Transparent.
c.addLegend(55, 22, False, "", 8).setBackground(Chart.Transparent)
' Add a title box to the chart using 13 pts Times Bold Italic font. The text is
' white (0xffffff) on a purple (0x800080) background, with a 1 pixel 3D border.
c.addTitle("Long Term Server Load", "Times New Roman Bold Italic", 13, &Hffffff _
).setBackground(&H800080, -1, 1)
' Add a title to the y axis
c.yAxis().setTitle("MBytes")
' Set the labels on the x axis. Rotate the font by 90 degrees.
c.xAxis().setLabels(labels).setFontAngle(90)
' Add a line layer to the chart
Dim lineLayer As LineLayer = c.addLineLayer()
' Add the data to the line layer using light brown color (0xcc9966) with a 7
' pixel square symbol
lineLayer.addDataSet(data, &Hcc9966, "Server Utilization").setDataSymbol( _
Chart.SquareSymbol, 7)
' Set the line width to 2 pixels
lineLayer.setLineWidth(2)
' tool tip for the line layer
lineLayer.setHTMLImageMap("", "", "title='{xLabel}: {value} MBytes'")
' Add a trend line layer using the same data with a dark green (0x008000) color.
' Set the line width to 2 pixels
Dim trendLayer As TrendLayer = c.addTrendLayer(data, &H008000, "Trend Line")
trendLayer.setLineWidth(2)
' tool tip for the trend layer
trendLayer.setHTMLImageMap("", "", _
"title='Change rate: {slope|2} MBytes/per month'")
' Output the chart
WebChartViewer1.Image = c.makeWebImage(Chart.PNG)
' include tool tip for the chart
WebChartViewer1.ImageMap = c.getHTMLImageMap("")
End Sub
</script>
<html>
<body>
<chart:WebChartViewer id="WebChartViewer1" runat="server" />
</body>
</html> |