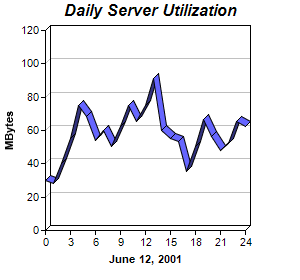
This example demonstrates setting the line to 3D by using Layer.set3D.
ChartDirector 5.1 (.NET Edition)
3D Line Chart
Source Code Listing
<%@ Page Language="VB" Debug="true" %>
<%@ Import Namespace="ChartDirector" %>
<%@ Register TagPrefix="chart" Namespace="ChartDirector" Assembly="netchartdir" %>
<script runat="server">

'
' Page Load event handler
'
Protected Sub Page_Load(ByVal sender As System.Object, ByVal e As System.EventArgs)

    ' The data for the line chart
    Dim data() As Double = {30, 28, 40, 55, 75, 68, 54, 60, 50, 62, 75, 65, 75, 91, _
        60, 55, 53, 35, 50, 66, 56, 48, 52, 65, 62}

    ' The labels for the line chart
    Dim labels() As String = {"0", "1", "2", "3", "4", "5", "6", "7", "8", "9", _
        "10", "11", "12", "13", "14", "15", "16", "17", "18", "19", "20", "21", _
        "22", "23", "24"}

    ' Create a XYChart object of size 300 x 280 pixels
    Dim c As XYChart = New XYChart(300, 280)

    ' Set the plotarea at (45, 30) and of size 200 x 200 pixels
    c.setPlotArea(45, 30, 200, 200)

    ' Add a title to the chart using 12 pts Arial Bold Italic font
    c.addTitle("Daily Server Utilization", "Arial Bold Italic", 12)

    ' Add a title to the y axis
    c.yAxis().setTitle("MBytes")

    ' Add a title to the x axis
    c.xAxis().setTitle("June 12, 2001")

    ' Add a blue (0x6666ff) 3D line chart layer using the give data
    c.addLineLayer(data, &H6666ff).set3D()

    ' Set the labels on the x axis.
    c.xAxis().setLabels(labels)

    ' Display 1 out of 3 labels on the x-axis.
    c.xAxis().setLabelStep(3)

    ' Output the chart
    WebChartViewer1.Image = c.makeWebImage(Chart.PNG)

    ' Include tool tip for the chart
    WebChartViewer1.ImageMap = c.getHTMLImageMap("", "", _
        "title='Hour {xLabel}: {value} MBytes'")

End Sub

</script>
<html>
<body>
    <chart:WebChartViewer id="WebChartViewer1" runat="server" />
</body>
</html> |
<%@ Page Language="C#" Debug="true" %>
<%@ Import Namespace="ChartDirector" %>
<%@ Register TagPrefix="chart" Namespace="ChartDirector" Assembly="netchartdir" %>
<script runat="server">

//
// Page Load event handler
//
protected void Page_Load(object sender, EventArgs e)
{
    // The data for the line chart
    double[] data = {30, 28, 40, 55, 75, 68, 54, 60, 50, 62, 75, 65, 75, 91, 60, 55,
        53, 35, 50, 66, 56, 48, 52, 65, 62};

    // The labels for the line chart
    string[] labels = {"0", "1", "2", "3", "4", "5", "6", "7", "8", "9", "10", "11",
        "12", "13", "14", "15", "16", "17", "18", "19", "20", "21", "22", "23", "24"}
        ;

    // Create a XYChart object of size 300 x 280 pixels
    XYChart c = new XYChart(300, 280);

    // Set the plotarea at (45, 30) and of size 200 x 200 pixels
    c.setPlotArea(45, 30, 200, 200);

    // Add a title to the chart using 12 pts Arial Bold Italic font
    c.addTitle("Daily Server Utilization", "Arial Bold Italic", 12);

    // Add a title to the y axis
    c.yAxis().setTitle("MBytes");

    // Add a title to the x axis
    c.xAxis().setTitle("June 12, 2001");

    // Add a blue (0x6666ff) 3D line chart layer using the give data
    c.addLineLayer(data, 0x6666ff).set3D();

    // Set the labels on the x axis.
    c.xAxis().setLabels(labels);

    // Display 1 out of 3 labels on the x-axis.
    c.xAxis().setLabelStep(3);

    // Output the chart
    WebChartViewer1.Image = c.makeWebImage(Chart.PNG);

    // Include tool tip for the chart
    WebChartViewer1.ImageMap = c.getHTMLImageMap("", "",
        "title='Hour {xLabel}: {value} MBytes'");
}

</script>
<html>
<body>
    <chart:WebChartViewer id="WebChartViewer1" runat="server" />
</body>
</html> |
Imports System
Imports Microsoft.VisualBasic
Imports ChartDirector

Public Class threedline
    Implements DemoModule

    'Name of demo module
    Public Function getName() As String Implements DemoModule.getName
        Return "3D Line Chart"
    End Function

    'Number of charts produced in this demo module
    Public Function getNoOfCharts() As Integer Implements DemoModule.getNoOfCharts
        Return 1
    End Function

    'Main code for creating chart.
    'Note: the argument img is unused because this demo only has 1 chart.
    Public Sub createChart(viewer As WinChartViewer, img As String) _
        Implements DemoModule.createChart

        ' The data for the line chart
        Dim data() As Double = {30, 28, 40, 55, 75, 68, 54, 60, 50, 62, 75, 65, 75, _
            91, 60, 55, 53, 35, 50, 66, 56, 48, 52, 65, 62}

        ' The labels for the line chart
        Dim labels() As String = {"0", "1", "2", "3", "4", "5", "6", "7", "8", "9", _
            "10", "11", "12", "13", "14", "15", "16", "17", "18", "19", "20", "21", _
            "22", "23", "24"}

        ' Create a XYChart object of size 300 x 280 pixels
        Dim c As XYChart = New XYChart(300, 280)

        ' Set the plotarea at (45, 30) and of size 200 x 200 pixels
        c.setPlotArea(45, 30, 200, 200)

        ' Add a title to the chart using 12 pts Arial Bold Italic font
        c.addTitle("Daily Server Utilization", "Arial Bold Italic", 12)

        ' Add a title to the y axis
        c.yAxis().setTitle("MBytes")

        ' Add a title to the x axis
        c.xAxis().setTitle("June 12, 2001")

        ' Add a blue (0x6666ff) 3D line chart layer using the give data
        c.addLineLayer(data, &H6666ff).set3D()

        ' Set the labels on the x axis.
        c.xAxis().setLabels(labels)

        ' Display 1 out of 3 labels on the x-axis.
        c.xAxis().setLabelStep(3)

        ' Output the chart
        viewer.Chart = c

        'include tool tip for the chart
        viewer.ImageMap = c.getHTMLImageMap("clickable", "", _
            "title='Hour {xLabel}: {value} MBytes'")

    End Sub

End Class |
using System;
using ChartDirector;

namespace CSharpChartExplorer
{
    public class threedline : DemoModule
    {
        //Name of demo module
        public string getName() { return "3D Line Chart"; }

        //Number of charts produced in this demo module
        public int getNoOfCharts() { return 1; }

        //Main code for creating chart.
        //Note: the argument img is unused because this demo only has 1 chart.
        public void createChart(WinChartViewer viewer, string img)
        {
            // The data for the line chart
            double[] data = {30, 28, 40, 55, 75, 68, 54, 60, 50, 62, 75, 65, 75, 91,
                60, 55, 53, 35, 50, 66, 56, 48, 52, 65, 62};

            // The labels for the line chart
            string[] labels = {"0", "1", "2", "3", "4", "5", "6", "7", "8", "9",
                "10", "11", "12", "13", "14", "15", "16", "17", "18", "19", "20",
                "21", "22", "23", "24"};

            // Create a XYChart object of size 300 x 280 pixels
            XYChart c = new XYChart(300, 280);

            // Set the plotarea at (45, 30) and of size 200 x 200 pixels
            c.setPlotArea(45, 30, 200, 200);

            // Add a title to the chart using 12 pts Arial Bold Italic font
            c.addTitle("Daily Server Utilization", "Arial Bold Italic", 12);

            // Add a title to the y axis
            c.yAxis().setTitle("MBytes");

            // Add a title to the x axis
            c.xAxis().setTitle("June 12, 2001");

            // Add a blue (0x6666ff) 3D line chart layer using the give data
            c.addLineLayer(data, 0x6666ff).set3D();

            // Set the labels on the x axis.
            c.xAxis().setLabels(labels);

            // Display 1 out of 3 labels on the x-axis.
            c.xAxis().setLabelStep(3);

            // Output the chart
            viewer.Chart = c;

            //include tool tip for the chart
            viewer.ImageMap = c.getHTMLImageMap("clickable", "",
                "title='Hour {xLabel}: {value} MBytes'");
        }
    }
} |