<%@ Page Language="VB" Debug="true" %>
<%@ Import Namespace="ChartDirector" %>
<%@ Register TagPrefix="chart" Namespace="ChartDirector" Assembly="netchartdir" %>
<script runat="server">
'
' Page Load event handler
'
Protected Sub Page_Load(ByVal sender As System.Object, ByVal e As System.EventArgs)
' The data for the pie chart
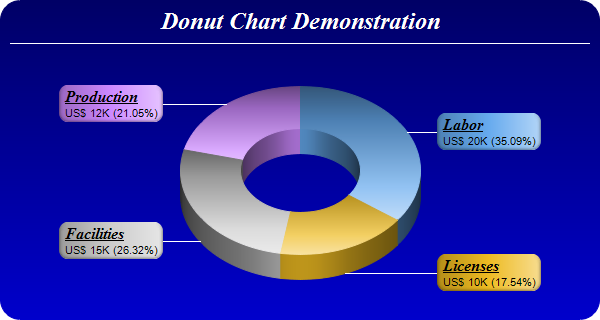
Dim data() As Double = {20, 10, 15, 12}
' The labels for the pie chart
Dim labels() As String = {"Labor", "Licenses", "Facilities", "Production"}
' The colors to use for the sectors
Dim colors() As Integer = {&H66aaee, &Heebb22, &Hcccccc, &Hcc88ff}
' Create a PieChart object of size 600 x 320 pixels. Use a vertical gradient
' color from deep blue (000066) to blue (0000cc) as background. Use rounded
' corners of 20 pixels radius.
Dim c As PieChart = New PieChart(600, 320)
c.setBackground(c.linearGradientColor(0, 0, 0, c.getHeight(), &H000066, _
&H0000cc))
c.setRoundedFrame(&Hffffff, 20)
' Add a title using 18 pts Times New Roman Bold Italic font in white (ffffff)
' color. Set top/bottom margins to 8 pixels.
Dim title As ChartDirector.TextBox = c.addTitle("Donut Chart Demonstration", _
"Times New Roman Bold Italic", 18, &Hffffff)
title.setMargin2(0, 0, 8, 8)
' Add a separator line in white color just under the title
c.addLine(10, title.getHeight(), c.getWidth() - 11, title.getHeight(), &Hffffff)
' Set donut center at (300, 170), and outer/inner radii as 120/60 pixels
c.setDonutSize(300, 170, 120, 60)
' Draw the pie in 3D with a pie thickness of 25 pixels
c.set3D(25)
' Set the pie data and the pie labels
c.setData(data, labels)
' Set the sector colors
c.setColors2(Chart.DataColor, colors)
' Use local gradient shading for the sectors
c.setSectorStyle(Chart.LocalGradientShading)
' Set sector border color to same as fill color. Set label join line color to
' white (ffffff)
c.setLineColor(Chart.SameAsMainColor, &Hffffff)
' Use the side label layout method, with the labels positioned 16 pixels from the
' donut bounding box
c.setLabelLayout(Chart.SideLayout, 16)
' Set the sector label format. The label consists of two lines. The first line is
' the sector name in Times Bold Italic font and is underlined. The second line
' shows the data value and percentage.
c.setLabelFormat( _
"<*block,halign=left*><*font=Times New Roman Bold " & _
"Italic,size=12,underline=1*>{label}<*/font*><*br*>US$ {value}K ({percent}%)")
' Set the label box background color the same as the sector color. Use soft
' lighting effect with light direction from right. Use rounded corners.
Dim t As ChartDirector.TextBox = c.setLabelStyle()
t.setBackground(Chart.SameAsMainColor, Chart.Transparent, Chart.softLighting( _
Chart.Right))
t.setRoundedCorners()
' Output the chart
WebChartViewer1.Image = c.makeWebImage(Chart.PNG)
' Include tool tip for the chart
WebChartViewer1.ImageMap = c.getHTMLImageMap("", "", _
"title='{label}: US${value}K ({percent}%)'")
End Sub
</script>
<html>
<body>
<chart:WebChartViewer id="WebChartViewer1" runat="server" />
</body>
</html> |