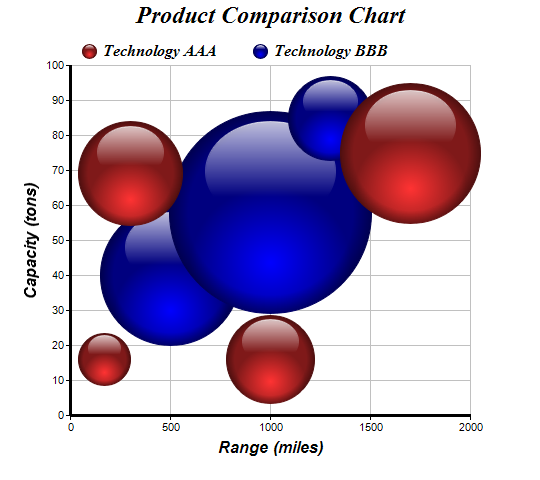
This examples demonstrates a bubble chart using glass spheres as bubbles.
ChartDirector 5.1 (.NET Edition)
3D Bubble Chart (1)
Source Code Listing
<%@ Page Language="VB" Debug="true" %>
<%@ Import Namespace="ChartDirector" %>
<%@ Register TagPrefix="chart" Namespace="ChartDirector" Assembly="netchartdir" %>
<script runat="server">

'
' Page Load event handler
'
Protected Sub Page_Load(ByVal sender As System.Object, ByVal e As System.EventArgs)

    ' The XYZ points for the bubble chart
    Dim dataX0() As Double = {170, 300, 1000, 1700}
    Dim dataY0() As Double = {16, 69, 16, 75}
    Dim dataZ0() As Double = {52, 105, 88, 140}

    Dim dataX1() As Double = {500, 1000, 1300}
    Dim dataY1() As Double = {40, 58, 85}
    Dim dataZ1() As Double = {140, 202, 84}

    ' Create a XYChart object of size 540 x 480 pixels
    Dim c As XYChart = New XYChart(540, 480)

    ' Set the plotarea at (70, 65) and of size 400 x 350 pixels. Turn on both
    ' horizontal and vertical grid lines with light grey color (0xc0c0c0)
    c.setPlotArea(70, 65, 400, 350, -1, -1, Chart.Transparent, &Hc0c0c0, -1)

    ' Add a legend box at (70, 30) (top of the chart) with horizontal layout. Use 12
    ' pts Times Bold Italic font. Set the background and border color to Transparent.
    c.addLegend(70, 30, False, "Times New Roman Bold Italic", 12).setBackground( _
        Chart.Transparent)

    ' Add a title to the chart using 18 pts Times Bold Itatic font.
    c.addTitle("Product Comparison Chart", "Times New Roman Bold Italic", 18)

    ' Add titles to the axes using 12 pts Arial Bold Italic font
    c.yAxis().setTitle("Capacity (tons)", "Arial Bold Italic", 12)
    c.xAxis().setTitle("Range (miles)", "Arial Bold Italic", 12)

    ' Set the axes line width to 3 pixels
    c.xAxis().setWidth(3)
    c.yAxis().setWidth(3)

    ' Add (dataX0, dataY0) as a scatter layer with red (ff3333) glass spheres, where
    ' the sphere size is modulated by dataZ0. This creates a bubble effect.
    c.addScatterLayer(dataX0, dataY0, "Technology AAA", Chart.GlassSphereShape, 15, _
        &Hff3333).setSymbolScale(dataZ0)

    ' Add (dataX1, dataY1) as a scatter layer with blue (0000ff) glass spheres, where
    ' the sphere size is modulated by dataZ1. This creates a bubble effect.
    c.addScatterLayer(dataX1, dataY1, "Technology BBB", Chart.GlassSphereShape, 15, _
        &H0000ff).setSymbolScale(dataZ1)

    ' Output the chart
    WebChartViewer1.Image = c.makeWebImage(Chart.PNG)

    ' Include tool tip for the chart
    WebChartViewer1.ImageMap = c.getHTMLImageMap("", "", _
        "title='[{dataSetName}] Range = {x} miles, Capacity = {value} tons, " & _
        "Length = {z} meters'")

End Sub

</script>
<html>
<body>
    <chart:WebChartViewer id="WebChartViewer1" runat="server" />
</body>
</html> |
<%@ Page Language="C#" Debug="true" %>
<%@ Import Namespace="ChartDirector" %>
<%@ Register TagPrefix="chart" Namespace="ChartDirector" Assembly="netchartdir" %>
<script runat="server">

//
// Page Load event handler
//
protected void Page_Load(object sender, EventArgs e)
{
    // The XYZ points for the bubble chart
    double[] dataX0 = {170, 300, 1000, 1700};
    double[] dataY0 = {16, 69, 16, 75};
    double[] dataZ0 = {52, 105, 88, 140};

    double[] dataX1 = {500, 1000, 1300};
    double[] dataY1 = {40, 58, 85};
    double[] dataZ1 = {140, 202, 84};

    // Create a XYChart object of size 540 x 480 pixels
    XYChart c = new XYChart(540, 480);

    // Set the plotarea at (70, 65) and of size 400 x 350 pixels. Turn on both
    // horizontal and vertical grid lines with light grey color (0xc0c0c0)
    c.setPlotArea(70, 65, 400, 350, -1, -1, Chart.Transparent, 0xc0c0c0, -1);

    // Add a legend box at (70, 30) (top of the chart) with horizontal layout. Use 12
    // pts Times Bold Italic font. Set the background and border color to
    // Transparent.
    c.addLegend(70, 30, false, "Times New Roman Bold Italic", 12).setBackground(
        Chart.Transparent);

    // Add a title to the chart using 18 pts Times Bold Itatic font.
    c.addTitle("Product Comparison Chart", "Times New Roman Bold Italic", 18);

    // Add titles to the axes using 12 pts Arial Bold Italic font
    c.yAxis().setTitle("Capacity (tons)", "Arial Bold Italic", 12);
    c.xAxis().setTitle("Range (miles)", "Arial Bold Italic", 12);

    // Set the axes line width to 3 pixels
    c.xAxis().setWidth(3);
    c.yAxis().setWidth(3);

    // Add (dataX0, dataY0) as a scatter layer with red (ff3333) glass spheres, where
    // the sphere size is modulated by dataZ0. This creates a bubble effect.
    c.addScatterLayer(dataX0, dataY0, "Technology AAA", Chart.GlassSphereShape, 15,
        0xff3333).setSymbolScale(dataZ0);

    // Add (dataX1, dataY1) as a scatter layer with blue (0000ff) glass spheres,
    // where the sphere size is modulated by dataZ1. This creates a bubble effect.
    c.addScatterLayer(dataX1, dataY1, "Technology BBB", Chart.GlassSphereShape, 15,
        0x0000ff).setSymbolScale(dataZ1);

    // Output the chart
    WebChartViewer1.Image = c.makeWebImage(Chart.PNG);

    // Include tool tip for the chart
    WebChartViewer1.ImageMap = c.getHTMLImageMap("", "",
        "title='[{dataSetName}] Range = {x} miles, Capacity = {value} tons, " +
        "Length = {z} meters'");
}

</script>
<html>
<body>
    <chart:WebChartViewer id="WebChartViewer1" runat="server" />
</body>
</html> |
Imports System
Imports Microsoft.VisualBasic
Imports ChartDirector

Public Class threedbubble
    Implements DemoModule

    'Name of demo module
    Public Function getName() As String Implements DemoModule.getName
        Return "3D Bubble Chart (1)"
    End Function

    'Number of charts produced in this demo module
    Public Function getNoOfCharts() As Integer Implements DemoModule.getNoOfCharts
        Return 1
    End Function

    'Main code for creating chart.
    'Note: the argument img is unused because this demo only has 1 chart.
    Public Sub createChart(viewer As WinChartViewer, img As String) _
        Implements DemoModule.createChart

        ' The XYZ points for the bubble chart
        Dim dataX0() As Double = {170, 300, 1000, 1700}
        Dim dataY0() As Double = {16, 69, 16, 75}
        Dim dataZ0() As Double = {52, 105, 88, 140}

        Dim dataX1() As Double = {500, 1000, 1300}
        Dim dataY1() As Double = {40, 58, 85}
        Dim dataZ1() As Double = {140, 202, 84}

        ' Create a XYChart object of size 540 x 480 pixels
        Dim c As XYChart = New XYChart(540, 480)

        ' Set the plotarea at (70, 65) and of size 400 x 350 pixels. Turn on both
        ' horizontal and vertical grid lines with light grey color (0xc0c0c0)
        c.setPlotArea(70, 65, 400, 350, -1, -1, Chart.Transparent, &Hc0c0c0, -1)

        ' Add a legend box at (70, 30) (top of the chart) with horizontal layout. Use
        ' 12 pts Times Bold Italic font. Set the background and border color to
        ' Transparent.
        c.addLegend(70, 30, False, "Times New Roman Bold Italic", 12 _
            ).setBackground(Chart.Transparent)

        ' Add a title to the chart using 18 pts Times Bold Itatic font.
        c.addTitle("Product Comparison Chart", "Times New Roman Bold Italic", 18)

        ' Add titles to the axes using 12 pts Arial Bold Italic font
        c.yAxis().setTitle("Capacity (tons)", "Arial Bold Italic", 12)
        c.xAxis().setTitle("Range (miles)", "Arial Bold Italic", 12)

        ' Set the axes line width to 3 pixels
        c.xAxis().setWidth(3)
        c.yAxis().setWidth(3)

        ' Add (dataX0, dataY0) as a scatter layer with red (ff3333) glass spheres,
        ' where the sphere size is modulated by dataZ0. This creates a bubble effect.
        c.addScatterLayer(dataX0, dataY0, "Technology AAA", Chart.GlassSphereShape, _
            15, &Hff3333).setSymbolScale(dataZ0)

        ' Add (dataX1, dataY1) as a scatter layer with blue (0000ff) glass spheres,
        ' where the sphere size is modulated by dataZ1. This creates a bubble effect.
        c.addScatterLayer(dataX1, dataY1, "Technology BBB", Chart.GlassSphereShape, _
            15, &H0000ff).setSymbolScale(dataZ1)

        ' Output the chart
        viewer.Chart = c

        'include tool tip for the chart
        viewer.ImageMap = c.getHTMLImageMap("clickable", "", _
            "title='[{dataSetName}] Range = {x} miles, Capacity = {value} tons, " & _
            "Length = {z} meters'")

    End Sub

End Class |
using System;
using ChartDirector;

namespace CSharpChartExplorer
{
    public class threedbubble : DemoModule
    {
        //Name of demo module
        public string getName() { return "3D Bubble Chart (1)"; }

        //Number of charts produced in this demo module
        public int getNoOfCharts() { return 1; }

        //Main code for creating chart.
        //Note: the argument img is unused because this demo only has 1 chart.
        public void createChart(WinChartViewer viewer, string img)
        {
            // The XYZ points for the bubble chart
            double[] dataX0 = {170, 300, 1000, 1700};
            double[] dataY0 = {16, 69, 16, 75};
            double[] dataZ0 = {52, 105, 88, 140};

            double[] dataX1 = {500, 1000, 1300};
            double[] dataY1 = {40, 58, 85};
            double[] dataZ1 = {140, 202, 84};

            // Create a XYChart object of size 540 x 480 pixels
            XYChart c = new XYChart(540, 480);

            // Set the plotarea at (70, 65) and of size 400 x 350 pixels. Turn on
            // both horizontal and vertical grid lines with light grey color
            // (0xc0c0c0)
            c.setPlotArea(70, 65, 400, 350, -1, -1, Chart.Transparent, 0xc0c0c0, -1);

            // Add a legend box at (70, 30) (top of the chart) with horizontal
            // layout. Use 12 pts Times Bold Italic font. Set the background and
            // border color to Transparent.
            c.addLegend(70, 30, false, "Times New Roman Bold Italic", 12
                ).setBackground(Chart.Transparent);

            // Add a title to the chart using 18 pts Times Bold Itatic font.
            c.addTitle("Product Comparison Chart", "Times New Roman Bold Italic", 18)
                ;

            // Add titles to the axes using 12 pts Arial Bold Italic font
            c.yAxis().setTitle("Capacity (tons)", "Arial Bold Italic", 12);
            c.xAxis().setTitle("Range (miles)", "Arial Bold Italic", 12);

            // Set the axes line width to 3 pixels
            c.xAxis().setWidth(3);
            c.yAxis().setWidth(3);

            // Add (dataX0, dataY0) as a scatter layer with red (ff3333) glass
            // spheres, where the sphere size is modulated by dataZ0. This creates a
            // bubble effect.
            c.addScatterLayer(dataX0, dataY0, "Technology AAA",
                Chart.GlassSphereShape, 15, 0xff3333).setSymbolScale(dataZ0);

            // Add (dataX1, dataY1) as a scatter layer with blue (0000ff) glass
            // spheres, where the sphere size is modulated by dataZ1. This creates a
            // bubble effect.
            c.addScatterLayer(dataX1, dataY1, "Technology BBB",
                Chart.GlassSphereShape, 15, 0x0000ff).setSymbolScale(dataZ1);

            // Output the chart
            viewer.Chart = c;

            //include tool tip for the chart
            viewer.ImageMap = c.getHTMLImageMap("clickable", "",
                "title='[{dataSetName}] Range = {x} miles, Capacity = {value} " +
                "tons, Length = {z} meters'");
        }
    }
} |