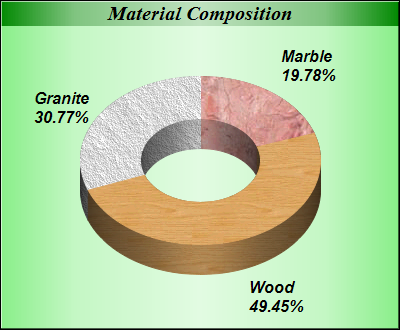
<%@ Page Language="VB" Debug="true" %>
<%@ Import Namespace="ChartDirector" %>
<%@ Register TagPrefix="chart" Namespace="ChartDirector" Assembly="netchartdir" %>
<script runat="server">

'
' Page Load event handler
'
Protected Sub Page_Load(ByVal sender As System.Object, ByVal e As System.EventArgs)

    ' The data for the pie chart
    Dim data() As Double = {18, 45, 28}

    ' The labels for the pie chart
    Dim labels() As String = {"Marble", "Wood", "Granite"}

    ' The icons for the sectors
    Dim texture() As String = {"marble3.png", "wood.png", "rock.png"}

    ' Create a PieChart object of size 400 x 330 pixels, with a metallic green
    ' (88EE88) background, black border and 1 pixel 3D border effect
    Dim c As PieChart = New PieChart(400, 330, Chart.metalColor(&H88ee88), _
        &H000000, 1)

    ' Set default directory for loading images from current script directory
    Call c.setSearchPath(Server.MapPath("."))

    ' Set donut center at (200, 160), and outer/inner radii as 120/60 pixels
    c.setDonutSize(200, 160, 120, 60)

    ' Add a title box using 15 pts Times Bold Italic font and metallic deep green
    ' (008000) background color
    c.addTitle("Material Composition", "Times New Roman Bold Italic", 15 _
        ).setBackground(Chart.metalColor(&H008000))

    ' Set the pie data and the pie labels
    c.setData(data, labels)

    ' Set the colors of the sectors to the 3 texture patterns
    c.setColor(Chart.DataColor + 0, c.patternColor2(texture(0)))
    c.setColor(Chart.DataColor + 1, c.patternColor2(texture(1)))
    c.setColor(Chart.DataColor + 2, c.patternColor2(texture(2)))

    ' Draw the pie in 3D with a 3D depth of 30 pixels
    c.set3D(30)

    ' Use 12 pts Arial Bold Italic as the sector label font
    c.setLabelStyle("Arial Bold Italic", 12)

    ' Output the chart
    WebChartViewer1.Image = c.makeWebImage(Chart.PNG)

    ' Include tool tip for the chart
    WebChartViewer1.ImageMap = c.getHTMLImageMap("", "", _
        "title='{label}: {value}kg ({percent}%)'")

End Sub

</script>
<html>
<body>
    <chart:WebChartViewer id="WebChartViewer1" runat="server" />
</body>
</html> |
