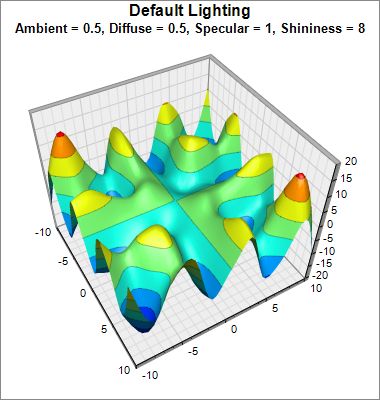
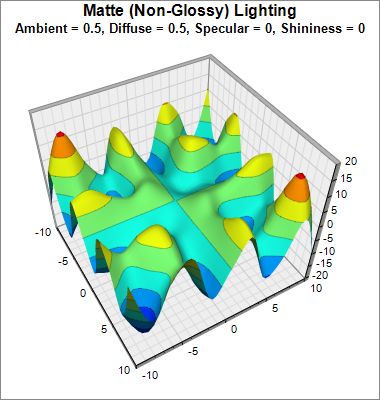
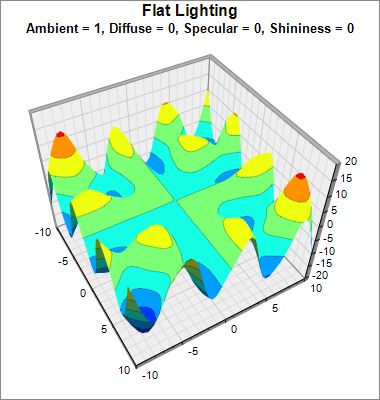
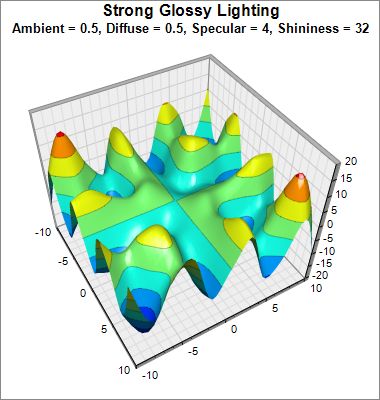
This example demonstrates the effects of various surface lighting parameters, configured using SurfaceChart.setLighting.
ChartDirector 5.1 (.NET Edition)
Surface Lighting
Source Code Listing
<%@ Page Language="VB" Debug="true" %>
<%@ Import Namespace="ChartDirector" %>
<%@ Register TagPrefix="chart" Namespace="ChartDirector" Assembly="netchartdir" %>
<script runat="server">

'
' Create chart
'
Protected Sub createChart(viewer As WebChartViewer, img As String)

    ' The x and y coordinates of the grid
    Dim dataX() As Double = {-10, -8, -6, -4, -2, 0, 2, 4, 6, 8, 10}
    Dim dataY() As Double = {-10, -8, -6, -4, -2, 0, 2, 4, 6, 8, 10}

    ' The values at the grid points. In this example, we will compute the values
    ' using the formula z = x * sin(y) + y * sin(x).
    Dim dataZ((UBound(dataX) + 1) * (UBound(dataY) + 1) - 1) As Double
    For yIndex As Integer = 0 To UBound(dataY)
        Dim y As Double = dataY(yIndex)
        For xIndex As Integer = 0 To UBound(dataX)
            Dim x As Double = dataX(xIndex)
            dataZ(yIndex * (UBound(dataX) + 1) + xIndex) = x * Math.Sin(y) + y * _
                Math.Sin(x)
        Next
    Next

    ' Create a SurfaceChart object of size 380 x 400 pixels, with white (ffffff)
    ' background and grey (888888) border.
    Dim c As SurfaceChart = New SurfaceChart(380, 400, &Hffffff, &H888888)

    ' Demonstrate various lighting parameters
    If img = "0" Then
        c.addTitle( _
            "Default Lighting<*br*><*size=10*>Ambient = 0.5, Diffuse = 0.5, " & _
            "Specular = 1, Shininess = 8")
    ElseIf img = "1" Then
        c.addTitle( _
            "Matte (Non-Glossy) Lighting<*br*><*size=10*>Ambient = 0.5, Diffuse " & _
            "= 0.5, Specular = 0, Shininess = 0")
        c.setLighting(0.5, 0.5, 0, 0)
    ElseIf img = "2" Then
        c.addTitle( _
            "Flat Lighting<*br*><*size=10*>Ambient = 1, Diffuse = 0, Specular = " & _
            "0, Shininess = 0")
        c.setLighting(1, 0, 0, 0)
    Else
        c.addTitle( _
            "Strong Glossy Lighting<*br*><*size=10*>Ambient = 0.5, Diffuse = " & _
            "0.5, Specular = 4, Shininess = 32")
        c.setLighting(0.5, 0.5, 4, 32)
    End If

    ' Set the center of the plot region at (175, 200), and set width x depth x height
    ' to 200 x 200 x 160 pixels
    c.setPlotRegion(175, 200, 200, 200, 160)

    ' Set the plot region wall thichness to 5 pixels
    c.setWallThickness(5)

    ' Set the elevation and rotation angles to 45 and 60 degrees
    c.setViewAngle(45, 60)

    ' Set the perspective level to 35
    c.setPerspective(35)

    ' Set the data to use to plot the chart
    c.setData(dataX, dataY, dataZ)

    ' Spline interpolate data to a 50 x 50 grid for a smooth surface
    c.setInterpolation(50, 50)

    ' Set contour lines to semi-transparent black (c0000000)
    c.setContourColor(&Hc0000000)

    ' Output the chart
    viewer.Image = c.makeWebImage(Chart.JPG)

End Sub

'
' Page Load event handler
'
Protected Sub Page_Load(ByVal sender As System.Object, ByVal e As System.EventArgs)

    createChart(WebChartViewer0, "0")
    createChart(WebChartViewer1, "1")
    createChart(WebChartViewer2, "2")
    createChart(WebChartViewer3, "3")

End Sub

</script>
<html>
<body>
    <chart:WebChartViewer id="WebChartViewer0" runat="server" />
    <chart:WebChartViewer id="WebChartViewer1" runat="server" />
    <chart:WebChartViewer id="WebChartViewer2" runat="server" />
    <chart:WebChartViewer id="WebChartViewer3" runat="server" />
</body>
</html> |
<%@ Page Language="C#" Debug="true" %>
<%@ Import Namespace="ChartDirector" %>
<%@ Register TagPrefix="chart" Namespace="ChartDirector" Assembly="netchartdir" %>
<script runat="server">

//
// Create chart
//
protected void createChart(WebChartViewer viewer, string img)
{
    // The x and y coordinates of the grid
    double[] dataX = {-10, -8, -6, -4, -2, 0, 2, 4, 6, 8, 10};
    double[] dataY = {-10, -8, -6, -4, -2, 0, 2, 4, 6, 8, 10};

    // The values at the grid points. In this example, we will compute the values
    // using the formula z = x * sin(y) + y * sin(x).
    double[] dataZ = new double[(dataX.Length) * (dataY.Length)];
    for(int yIndex = 0; yIndex < dataY.Length; ++yIndex) {
        double y = dataY[yIndex];
        for(int xIndex = 0; xIndex < dataX.Length; ++xIndex) {
            double x = dataX[xIndex];
            dataZ[yIndex * (dataX.Length) + xIndex] = x * Math.Sin(y) + y * Math.Sin(
                x);
        }
    }

    // Create a SurfaceChart object of size 380 x 400 pixels, with white (ffffff)
    // background and grey (888888) border.
    SurfaceChart c = new SurfaceChart(380, 400, 0xffffff, 0x888888);

    // Demonstrate various lighting parameters
    if (img == "0") {
        c.addTitle(
            "Default Lighting<*br*><*size=10*>Ambient = 0.5, Diffuse = 0.5, " +
            "Specular = 1, Shininess = 8");
    } else if (img == "1") {
        c.addTitle(
            "Matte (Non-Glossy) Lighting<*br*><*size=10*>Ambient = 0.5, Diffuse = " +
            "0.5, Specular = 0, Shininess = 0");
        c.setLighting(0.5, 0.5, 0, 0);
    } else if (img == "2") {
        c.addTitle(
            "Flat Lighting<*br*><*size=10*>Ambient = 1, Diffuse = 0, Specular = " +
            "0, Shininess = 0");
        c.setLighting(1, 0, 0, 0);
    } else {
        c.addTitle(
            "Strong Glossy Lighting<*br*><*size=10*>Ambient = 0.5, Diffuse = 0.5, " +
            "Specular = 4, Shininess = 32");
        c.setLighting(0.5, 0.5, 4, 32);
    }

    // Set the center of the plot region at (175, 200), and set width x depth x
    // height to 200 x 200 x 160 pixels
    c.setPlotRegion(175, 200, 200, 200, 160);

    // Set the plot region wall thichness to 5 pixels
    c.setWallThickness(5);

    // Set the elevation and rotation angles to 45 and 60 degrees
    c.setViewAngle(45, 60);

    // Set the perspective level to 35
    c.setPerspective(35);

    // Set the data to use to plot the chart
    c.setData(dataX, dataY, dataZ);

    // Spline interpolate data to a 50 x 50 grid for a smooth surface
    c.setInterpolation(50, 50);

    // Set contour lines to semi-transparent black (c0000000)
    c.setContourColor(unchecked((int)0xc0000000));

    // Output the chart
    viewer.Image = c.makeWebImage(Chart.JPG);
}

//
// Page Load event handler
//
protected void Page_Load(object sender, EventArgs e)
{
    createChart(WebChartViewer0, "0");
    createChart(WebChartViewer1, "1");
    createChart(WebChartViewer2, "2");
    createChart(WebChartViewer3, "3");
}

</script>
<html>
<body>
    <chart:WebChartViewer id="WebChartViewer0" runat="server" />
    <chart:WebChartViewer id="WebChartViewer1" runat="server" />
    <chart:WebChartViewer id="WebChartViewer2" runat="server" />
    <chart:WebChartViewer id="WebChartViewer3" runat="server" />
</body>
</html> |
Imports System
Imports Microsoft.VisualBasic
Imports ChartDirector

Public Class surfacelighting
    Implements DemoModule

    'Name of demo module
    Public Function getName() As String Implements DemoModule.getName
        Return "Surface Lighting"
    End Function

    'Number of charts produced in this demo module
    Public Function getNoOfCharts() As Integer Implements DemoModule.getNoOfCharts
        Return 4
    End Function

    'Main code for creating charts
    Public Sub createChart(viewer As WinChartViewer, img As String) _
        Implements DemoModule.createChart

        ' The x and y coordinates of the grid
        Dim dataX() As Double = {-10, -8, -6, -4, -2, 0, 2, 4, 6, 8, 10}
        Dim dataY() As Double = {-10, -8, -6, -4, -2, 0, 2, 4, 6, 8, 10}

        ' The values at the grid points. In this example, we will compute the values
        ' using the formula z = x * sin(y) + y * sin(x).
        Dim dataZ((UBound(dataX) + 1) * (UBound(dataY) + 1) - 1) As Double
        For yIndex As Integer = 0 To UBound(dataY)
            Dim y As Double = dataY(yIndex)
            For xIndex As Integer = 0 To UBound(dataX)
                Dim x As Double = dataX(xIndex)
                dataZ(yIndex * (UBound(dataX) + 1) + xIndex) = x * Math.Sin(y) + y _
                     * Math.Sin(x)
            Next
        Next

        ' Create a SurfaceChart object of size 380 x 400 pixels, with white (ffffff)
        ' background and grey (888888) border.
        Dim c As SurfaceChart = New SurfaceChart(380, 400, &Hffffff, &H888888)

        ' Demonstrate various lighting parameters
        If img = "0" Then
            c.addTitle( _
                "Default Lighting<*br*><*size=10*>Ambient = 0.5, Diffuse = 0.5, " & _
                "Specular = 1, Shininess = 8")
        ElseIf img = "1" Then
            c.addTitle( _
                "Matte (Non-Glossy) Lighting<*br*><*size=10*>Ambient = 0.5, " & _
                "Diffuse = 0.5, Specular = 0, Shininess = 0")
            c.setLighting(0.5, 0.5, 0, 0)
        ElseIf img = "2" Then
            c.addTitle( _
                "Flat Lighting<*br*><*size=10*>Ambient = 1, Diffuse = 0, " & _
                "Specular = 0, Shininess = 0")
            c.setLighting(1, 0, 0, 0)
        Else
            c.addTitle( _
                "Strong Glossy Lighting<*br*><*size=10*>Ambient = 0.5, Diffuse " & _
                "= 0.5, Specular = 4, Shininess = 32")
            c.setLighting(0.5, 0.5, 4, 32)
        End If

        ' Set the center of the plot region at (175, 200), and set width x depth x
        ' height to 200 x 200 x 160 pixels
        c.setPlotRegion(175, 200, 200, 200, 160)

        ' Set the plot region wall thichness to 5 pixels
        c.setWallThickness(5)

        ' Set the elevation and rotation angles to 45 and 60 degrees
        c.setViewAngle(45, 60)

        ' Set the perspective level to 35
        c.setPerspective(35)

        ' Set the data to use to plot the chart
        c.setData(dataX, dataY, dataZ)

        ' Spline interpolate data to a 50 x 50 grid for a smooth surface
        c.setInterpolation(50, 50)

        ' Set contour lines to semi-transparent black (c0000000)
        c.setContourColor(&Hc0000000)

        ' Output the chart
        viewer.Chart = c

    End Sub

End Class |
using System;
using ChartDirector;

namespace CSharpChartExplorer
{
    public class surfacelighting : DemoModule
    {
        //Name of demo module
        public string getName() { return "Surface Lighting"; }

        //Number of charts produced in this demo module
        public int getNoOfCharts() { return 4; }

        //Main code for creating charts
        public void createChart(WinChartViewer viewer, string img)
        {
            // The x and y coordinates of the grid
            double[] dataX = {-10, -8, -6, -4, -2, 0, 2, 4, 6, 8, 10};
            double[] dataY = {-10, -8, -6, -4, -2, 0, 2, 4, 6, 8, 10};

            // The values at the grid points. In this example, we will compute the
            // values using the formula z = x * sin(y) + y * sin(x).
            double[] dataZ = new double[(dataX.Length) * (dataY.Length)];
            for(int yIndex = 0; yIndex < dataY.Length; ++yIndex) {
                double y = dataY[yIndex];
                for(int xIndex = 0; xIndex < dataX.Length; ++xIndex) {
                    double x = dataX[xIndex];
                    dataZ[yIndex * (dataX.Length) + xIndex] = x * Math.Sin(y) + y *
                        Math.Sin(x);
                }
            }

            // Create a SurfaceChart object of size 380 x 400 pixels, with white
            // (ffffff) background and grey (888888) border.
            SurfaceChart c = new SurfaceChart(380, 400, 0xffffff, 0x888888);

            // Demonstrate various lighting parameters
            if (img == "0") {
                c.addTitle(
                    "Default Lighting<*br*><*size=10*>Ambient = 0.5, Diffuse = " +
                    "0.5, Specular = 1, Shininess = 8");
            } else if (img == "1") {
                c.addTitle(
                    "Matte (Non-Glossy) Lighting<*br*><*size=10*>Ambient = 0.5, " +
                    "Diffuse = 0.5, Specular = 0, Shininess = 0");
                c.setLighting(0.5, 0.5, 0, 0);
            } else if (img == "2") {
                c.addTitle(
                    "Flat Lighting<*br*><*size=10*>Ambient = 1, Diffuse = 0, " +
                    "Specular = 0, Shininess = 0");
                c.setLighting(1, 0, 0, 0);
            } else {
                c.addTitle(
                    "Strong Glossy Lighting<*br*><*size=10*>Ambient = 0.5, " +
                    "Diffuse = 0.5, Specular = 4, Shininess = 32");
                c.setLighting(0.5, 0.5, 4, 32);
            }

            // Set the center of the plot region at (175, 200), and set width x depth
            // x height to 200 x 200 x 160 pixels
            c.setPlotRegion(175, 200, 200, 200, 160);

            // Set the plot region wall thichness to 5 pixels
            c.setWallThickness(5);

            // Set the elevation and rotation angles to 45 and 60 degrees
            c.setViewAngle(45, 60);

            // Set the perspective level to 35
            c.setPerspective(35);

            // Set the data to use to plot the chart
            c.setData(dataX, dataY, dataZ);

            // Spline interpolate data to a 50 x 50 grid for a smooth surface
            c.setInterpolation(50, 50);

            // Set contour lines to semi-transparent black (c0000000)
            c.setContourColor(unchecked((int)0xc0000000));

            // Output the chart
            viewer.Chart = c;
        }
    }
} |