<%@ Page Language="VB" Debug="true" %>
<%@ Import Namespace="ChartDirector" %>
<%@ Register TagPrefix="chart" Namespace="ChartDirector" Assembly="netchartdir" %>
<script runat="server">
'
' Page Load event handler
'
Protected Sub Page_Load(ByVal sender As System.Object, ByVal e As System.EventArgs)
' The (x, y, z) coordinates of the scattered data
Dim dataX() As Double = {0.5, 1.9, 4.9, 1.0, 8.9, 9.8, 5.9, 2.9, 6.8, 9.0, 0.0, _
8.9, 1.9, 4.8, 2.4, 3.4, 7.9, 7.5, 4.8, 7.5, 9.5, 0.4, 8.9, 0.9, 5.4, 9.4, _
2.9, 8.9, 0.9, 8.9, 10.0, 1.0, 6.8, 3.8, 9.0, 5.3, 6.4, 4.9, 4.5, 2.0, 5.4, _
0.0, 10.0, 3.9, 5.4, 5.9, 5.8, 0.3, 4.4, 8.3}
Dim dataY() As Double = {3.3, 3.0, 0.7, 1.0, 9.3, 4.5, 8.4, 0.1, 0.8, 0.1, 9.3, _
1.8, 4.3, 1.3, 2.3, 5.4, 6.9, 9.0, 9.8, 7.5, 1.8, 1.4, 4.5, 7.8, 3.8, 4.0, _
2.9, 2.4, 3.9, 2.9, 2.3, 9.3, 2.0, 3.4, 4.8, 2.3, 3.4, 2.3, 1.5, 7.8, 4.5, _
0.9, 6.3, 2.4, 6.9, 2.8, 1.3, 2.9, 6.4, 6.3}
Dim dataZ() As Double = {6.6, 12.5, 7.4, 6.2, 9.6, 13.6, 19.9, 2.2, 6.9, 3.4, _
8.7, 8.4, 7.8, 8.0, 9.4, 11.9, 9.6, 15.7, 12.0, 13.3, 9.6, 6.4, 9.0, 6.9, _
4.6, 9.7, 10.6, 9.2, 7.0, 6.9, 9.7, 8.6, 8.0, 13.6, 13.2, 5.9, 9.0, 3.2, _
8.3, 9.7, 8.2, 6.1, 8.7, 5.6, 14.9, 9.8, 9.3, 5.1, 10.8, 9.8}
' Create a SurfaceChart object of size 680 x 550 pixels. Set background to
' brushed silver and border to grey (888888). Set the top-left and bottom-right
' corners to rounded corners with 20 pixels radius.
Dim c As SurfaceChart = New SurfaceChart(680, 550, Chart.brushedSilverColor(), _
&H888888)
c.setRoundedFrame(&Hffffff, 20, 0, 20, 0)
' Add a title to the chart using 20 points Times New Roman Italic font. Set
' top/bottom margin to 8 pixels.
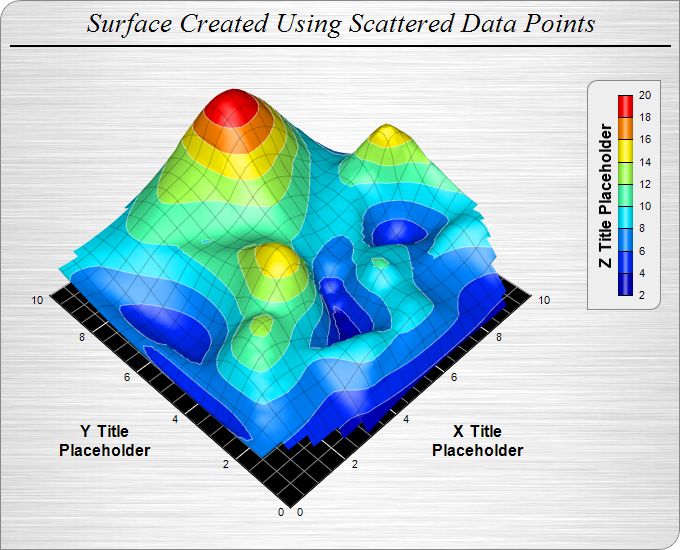
Dim title As ChartDirector.TextBox = c.addTitle( _
"Surface Created Using Scattered Data Points", "Times New Roman Italic", 20)
title.setMargin2(0, 0, 8, 8)
' Add a 2 pixel wide black (000000) separator line under the title
c.addLine(10, title.getHeight(), c.getWidth() - 10, title.getHeight(), _
&H000000, 2)
' Set the center of the plot region at (290, 235), and set width x depth x height
' to 360 x 360 x 180 pixels
c.setPlotRegion(290, 235, 360, 360, 180)
' Set the elevation and rotation angles to 45 and -45 degrees
c.setViewAngle(45, -45)
' Set the perspective level to 30
c.setPerspective(30)
' Set the data to use to plot the chart
c.setData(dataX, dataY, dataZ)
' Add a color axis (the legend) in which the top right corner is anchored at
' (660, 80). Set the length to 200 pixels and the labels on the right side.
Dim cAxis As ColorAxis = c.setColorAxis(660, 80, Chart.TopRight, 200, _
Chart.Right)
' Set the color axis title with 12 points Arial Bold font
cAxis.setTitle("Z Title Placeholder", "Arial Bold", 12)
' Add a bounding box with light grey (eeeeee) background and grey (888888)
' border. Set the top-left and bottom-right corners to rounded corners of 10
' pixels radius.
cAxis.setBoundingBox(&Heeeeee, &H888888)
cAxis.setRoundedCorners(10, 0, 10, 0)
' Set surface grid lines to semi-transparent black (cc000000)
c.setSurfaceAxisGrid(&Hcc000000)
' Set contour lines to semi-transparent white (80ffffff)
c.setContourColor(&H80ffffff)
' Set the walls to black in color
c.setWallColor(&H000000)
' Set the xyz major wall grid lines to white (ffffff), and minor wall grid lines
' to grey (888888)
c.setWallGrid(&Hffffff, &Hffffff, &Hffffff, &H888888, &H888888, &H888888)
' Set the wall thickness to 0
c.setWallThickness(0, 0, 0)
' Show only the xy wall, and hide the yz and zx walls.
c.setWallVisibility(True, False, False)
' Set the x, y and z axis titles using 12 points Arial Bold font
c.xAxis().setTitle("X Title<*br*>Placeholder", "Arial Bold", 12)
c.yAxis().setTitle("Y Title<*br*>Placeholder", "Arial Bold", 12)
' Output the chart
WebChartViewer1.Image = c.makeWebImage(Chart.JPG)
End Sub
</script>
<html>
<body>
<chart:WebChartViewer id="WebChartViewer1" runat="server" />
</body>
</html> |