<%@ Page Language="VB" Debug="true" %>
<%@ Import Namespace="ChartDirector" %>
<%@ Register TagPrefix="chart" Namespace="ChartDirector" Assembly="netchartdir" %>
<script runat="server">
'
' Page Load event handler
'
Protected Sub Page_Load(ByVal sender As System.Object, ByVal e As System.EventArgs)
' The (x, y, z) coordinates of the scattered data
Dim dataX() As Double = {0.5, 1.9, 4.9, 1.0, 8.9, 9.8, 5.9, 2.9, 6.8, 9.0, 0.0, _
8.9, 1.9, 4.8, 2.4, 3.4, 7.9, 7.5, 4.8, 7.5, 9.5, 0.4, 8.9, 0.9, 5.4, 9.4, _
2.9, 8.9, 0.9, 8.9, 10.0, 1.0, 6.8, 3.8, 9.0, 5.3, 6.4, 4.9, 4.5, 2.0, 5.4, _
0.0, 10.0, 3.9, 5.4, 5.9, 5.8, 0.3, 4.4, 8.3}
Dim dataY() As Double = {3.3, 3.0, 0.7, 1.0, 9.3, 4.5, 8.4, 0.1, 0.8, 0.1, 9.3, _
1.8, 4.3, 1.3, 2.3, 5.4, 6.9, 9.0, 9.8, 7.5, 1.8, 1.4, 4.5, 7.8, 3.8, 4.0, _
2.9, 2.4, 3.9, 2.9, 2.3, 9.3, 2.0, 3.4, 4.8, 2.3, 3.4, 2.3, 1.5, 7.8, 4.5, _
0.9, 6.3, 2.4, 6.9, 2.8, 1.3, 2.9, 6.4, 6.3}
Dim dataZ() As Double = {6.6, 12.5, 7.4, 6.2, 9.6, 13.6, 19.9, 2.2, 6.9, 3.4, _
8.7, 8.4, 7.8, 8.0, 9.4, 11.9, 9.6, 15.7, 12.0, 13.3, 9.6, 6.4, 9.0, 6.9, _
4.6, 9.7, 10.6, 9.2, 7.0, 6.9, 9.7, 8.6, 8.0, 13.6, 13.2, 5.9, 9.0, 3.2, _
8.3, 9.7, 8.2, 6.1, 8.7, 5.6, 14.9, 9.8, 9.3, 5.1, 10.8, 9.8}
' Create a XYChart object of size 450 x 540 pixels
Dim c As XYChart = New XYChart(450, 540)
' Add a title to the chart using 15 points Arial Italic font
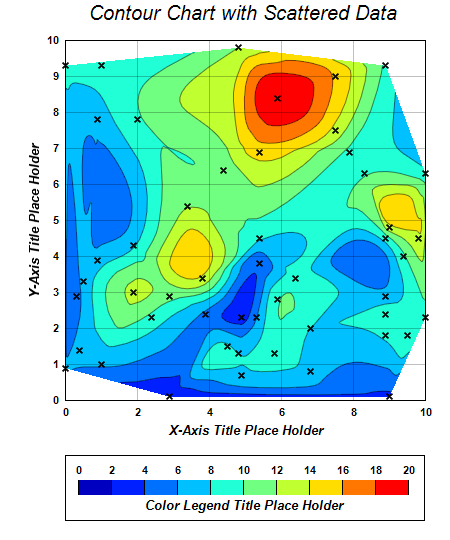
c.addTitle(" Contour Chart with Scattered Data", "Arial Italic", 15)
' Set the plotarea at (65, 40) and of size 360 x 360 pixels. Use semi-transparent
' black (c0000000) for both horizontal and vertical grid lines
c.setPlotArea(65, 40, 360, 360, -1, -1, -1, &Hc0000000, -1)
' Set x-axis and y-axis title using 12 points Arial Bold Italic font
c.xAxis().setTitle("X-Axis Title Place Holder", "Arial Bold Italic", 10)
c.yAxis().setTitle("Y-Axis Title Place Holder", "Arial Bold Italic", 10)
' Set x-axis and y-axis labels to use Arial Bold font
c.xAxis().setLabelStyle("Arial Bold")
c.yAxis().setLabelStyle("Arial Bold")
' When x-axis and y-axis color to transparent
c.xAxis().setColors(Chart.Transparent)
c.yAxis().setColors(Chart.Transparent)
' Add a scatter layer to the chart to show the position of the data points
c.addScatterLayer(dataX, dataY, "", Chart.Cross2Shape(0.2), 7, &H000000)
' Add a contour layer using the given data
Dim layer As ContourLayer = c.addContourLayer(dataX, dataY, dataZ)
' Move the grid lines in front of the contour layer
c.getPlotArea().moveGridBefore(layer)
' Add a color axis (the legend) in which the top center is anchored at (245,
' 455). Set the length to 330 pixels and the labels on the top side.
Dim cAxis As ColorAxis = layer.setColorAxis(245, 455, Chart.TopCenter, 330, _
Chart.Top)
' Add a bounding box to the color axis using the default line color as border.
cAxis.setBoundingBox(Chart.Transparent, Chart.LineColor)
' Add a title to the color axis using 12 points Arial Bold Italic font
cAxis.setTitle("Color Legend Title Place Holder", "Arial Bold Italic", 10)
' Set color axis labels to use Arial Bold font
cAxis.setLabelStyle("Arial Bold")
' Set the color axis range as 0 to 20, with a step every 2 units
cAxis.setLinearScale(0, 20, 2)
' Output the chart
WebChartViewer1.Image = c.makeWebImage(Chart.PNG)
End Sub
</script>
<html>
<body>
<chart:WebChartViewer id="WebChartViewer1" runat="server" />
</body>
</html> |