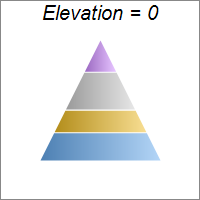
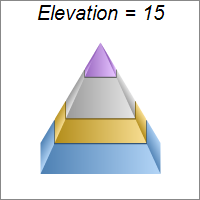
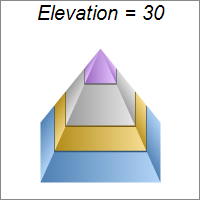
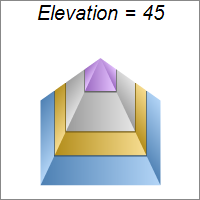
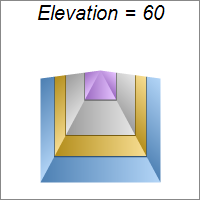
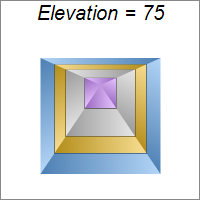
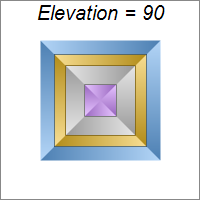
This example demonstrates viewing the pyramid at different elevation angles, configured with PyramidChart.setViewAngle.
ChartDirector 5.1 (.NET Edition)
Pyramid Elevation
Source Code Listing
<%@ Page Language="VB" Debug="true" %>
<%@ Import Namespace="ChartDirector" %>
<%@ Register TagPrefix="chart" Namespace="ChartDirector" Assembly="netchartdir" %>
<script runat="server">

'
' Create chart
'
Protected Sub createChart(viewer As WebChartViewer, img As String)

    ' The data for the pyramid chart
    Dim data() As Double = {156, 123, 211, 179}

    ' The colors for the pyramid layers
    Dim colors() As Integer = {&H66aaee, &Heebb22, &Hcccccc, &Hcc88ff}

    ' The elevation angle
    Dim angle As Integer = CInt(img) * 15

    ' Create a PyramidChart object of size 200 x 200 pixels, with white (ffffff)
    ' background and grey (888888) border
    Dim c As PyramidChart = New PyramidChart(200, 200, &Hffffff, &H888888)

    ' Set the pyramid center at (100, 100), and width x height to 60 x 120 pixels
    c.setPyramidSize(100, 100, 60, 120)

    ' Set the elevation angle
    c.addTitle("Elevation = " & angle, "Arial Italic", 15)
    c.setViewAngle(angle)

    ' Set the pyramid data
    c.setData(data)

    ' Set the layer colors to the given colors
    c.setColors2(Chart.DataColor, colors)

    ' Leave 1% gaps between layers
    c.setLayerGap(0.01)

    ' Output the chart
    viewer.Image = c.makeWebImage(Chart.PNG)

End Sub

'
' Page Load event handler
'
Protected Sub Page_Load(ByVal sender As System.Object, ByVal e As System.EventArgs)

    createChart(WebChartViewer0, "0")
    createChart(WebChartViewer1, "1")
    createChart(WebChartViewer2, "2")
    createChart(WebChartViewer3, "3")
    createChart(WebChartViewer4, "4")
    createChart(WebChartViewer5, "5")
    createChart(WebChartViewer6, "6")

End Sub

</script>
<html>
<body>
    <chart:WebChartViewer id="WebChartViewer0" runat="server" />
    <chart:WebChartViewer id="WebChartViewer1" runat="server" />
    <chart:WebChartViewer id="WebChartViewer2" runat="server" />
    <chart:WebChartViewer id="WebChartViewer3" runat="server" />
    <chart:WebChartViewer id="WebChartViewer4" runat="server" />
    <chart:WebChartViewer id="WebChartViewer5" runat="server" />
    <chart:WebChartViewer id="WebChartViewer6" runat="server" />
</body>
</html> |
<%@ Page Language="C#" Debug="true" %>
<%@ Import Namespace="ChartDirector" %>
<%@ Register TagPrefix="chart" Namespace="ChartDirector" Assembly="netchartdir" %>
<script runat="server">

//
// Create chart
//
protected void createChart(WebChartViewer viewer, string img)
{
    // The data for the pyramid chart
    double[] data = {156, 123, 211, 179};

    // The colors for the pyramid layers
    int[] colors = {0x66aaee, 0xeebb22, 0xcccccc, 0xcc88ff};

    // The elevation angle
    int angle = int.Parse(img) * 15;

    // Create a PyramidChart object of size 200 x 200 pixels, with white (ffffff)
    // background and grey (888888) border
    PyramidChart c = new PyramidChart(200, 200, 0xffffff, 0x888888);

    // Set the pyramid center at (100, 100), and width x height to 60 x 120 pixels
    c.setPyramidSize(100, 100, 60, 120);

    // Set the elevation angle
    c.addTitle("Elevation = " + angle, "Arial Italic", 15);
    c.setViewAngle(angle);

    // Set the pyramid data
    c.setData(data);

    // Set the layer colors to the given colors
    c.setColors2(Chart.DataColor, colors);

    // Leave 1% gaps between layers
    c.setLayerGap(0.01);

    // Output the chart
    viewer.Image = c.makeWebImage(Chart.PNG);
}

//
// Page Load event handler
//
protected void Page_Load(object sender, EventArgs e)
{
    createChart(WebChartViewer0, "0");
    createChart(WebChartViewer1, "1");
    createChart(WebChartViewer2, "2");
    createChart(WebChartViewer3, "3");
    createChart(WebChartViewer4, "4");
    createChart(WebChartViewer5, "5");
    createChart(WebChartViewer6, "6");
}

</script>
<html>
<body>
    <chart:WebChartViewer id="WebChartViewer0" runat="server" />
    <chart:WebChartViewer id="WebChartViewer1" runat="server" />
    <chart:WebChartViewer id="WebChartViewer2" runat="server" />
    <chart:WebChartViewer id="WebChartViewer3" runat="server" />
    <chart:WebChartViewer id="WebChartViewer4" runat="server" />
    <chart:WebChartViewer id="WebChartViewer5" runat="server" />
    <chart:WebChartViewer id="WebChartViewer6" runat="server" />
</body>
</html> |
Imports System
Imports Microsoft.VisualBasic
Imports ChartDirector

Public Class pyramidelevation
    Implements DemoModule

    'Name of demo module
    Public Function getName() As String Implements DemoModule.getName
        Return "Pyramid Elevation"
    End Function

    'Number of charts produced in this demo module
    Public Function getNoOfCharts() As Integer Implements DemoModule.getNoOfCharts
        Return 7
    End Function

    'Main code for creating charts
    Public Sub createChart(viewer As WinChartViewer, img As String) _
        Implements DemoModule.createChart

        ' The data for the pyramid chart
        Dim data() As Double = {156, 123, 211, 179}

        ' The colors for the pyramid layers
        Dim colors() As Integer = {&H66aaee, &Heebb22, &Hcccccc, &Hcc88ff}

        ' The elevation angle
        Dim angle As Integer = CInt(img) * 15

        ' Create a PyramidChart object of size 200 x 200 pixels, with white (ffffff)
        ' background and grey (888888) border
        Dim c As PyramidChart = New PyramidChart(200, 200, &Hffffff, &H888888)

        ' Set the pyramid center at (100, 100), and width x height to 60 x 120 pixels
        c.setPyramidSize(100, 100, 60, 120)

        ' Set the elevation angle
        c.addTitle("Elevation = " & angle, "Arial Italic", 15)
        c.setViewAngle(angle)

        ' Set the pyramid data
        c.setData(data)

        ' Set the layer colors to the given colors
        c.setColors2(Chart.DataColor, colors)

        ' Leave 1% gaps between layers
        c.setLayerGap(0.01)

        ' Output the chart
        viewer.Chart = c

    End Sub

End Class |
using System;
using ChartDirector;

namespace CSharpChartExplorer
{
    public class pyramidelevation : DemoModule
    {
        //Name of demo module
        public string getName() { return "Pyramid Elevation"; }

        //Number of charts produced in this demo module
        public int getNoOfCharts() { return 7; }

        //Main code for creating charts
        public void createChart(WinChartViewer viewer, string img)
        {
            // The data for the pyramid chart
            double[] data = {156, 123, 211, 179};

            // The colors for the pyramid layers
            int[] colors = {0x66aaee, 0xeebb22, 0xcccccc, 0xcc88ff};

            // The elevation angle
            int angle = int.Parse(img) * 15;

            // Create a PyramidChart object of size 200 x 200 pixels, with white
            // (ffffff) background and grey (888888) border
            PyramidChart c = new PyramidChart(200, 200, 0xffffff, 0x888888);

            // Set the pyramid center at (100, 100), and width x height to 60 x 120
            // pixels
            c.setPyramidSize(100, 100, 60, 120);

            // Set the elevation angle
            c.addTitle("Elevation = " + angle, "Arial Italic", 15);
            c.setViewAngle(angle);

            // Set the pyramid data
            c.setData(data);

            // Set the layer colors to the given colors
            c.setColors2(Chart.DataColor, colors);

            // Leave 1% gaps between layers
            c.setLayerGap(0.01);

            // Output the chart
            viewer.Chart = c;
        }
    }
} |