<%@ Page Language="VB" Debug="true" %>
<%@ Import Namespace="ChartDirector" %>
<%@ Register TagPrefix="chart" Namespace="ChartDirector" Assembly="netchartdir" %>
<script runat="server">
'
' Page Load event handler
'
Protected Sub Page_Load(ByVal sender As System.Object, ByVal e As System.EventArgs)
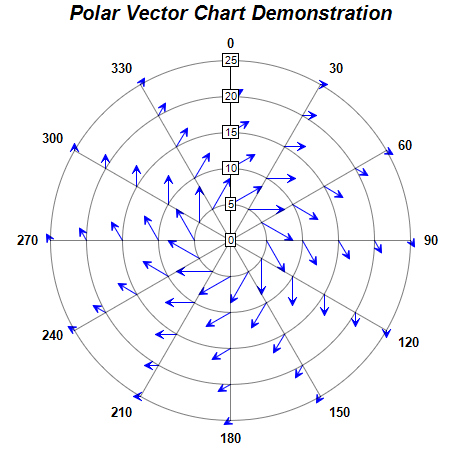
' Coordinates of the starting points of the vectors
Dim radius() As Double = {5, 5, 5, 5, 5, 5, 5, 5, 5, 5, 5, 5, 10, 10, 10, 10, _
10, 10, 10, 10, 10, 10, 10, 10, 15, 15, 15, 15, 15, 15, 15, 15, 15, 15, 15, _
15, 20, 20, 20, 20, 20, 20, 20, 20, 20, 20, 20, 20, 25, 25, 25, 25, 25, 25, _
25, 25, 25, 25, 25, 25}
Dim angle() As Double = {0, 30, 60, 90, 120, 150, 180, 210, 240, 270, 300, 330, _
0, 30, 60, 90, 120, 150, 180, 210, 240, 270, 300, 330, 0, 30, 60, 90, 120, _
150, 180, 210, 240, 270, 300, 330, 0, 30, 60, 90, 120, 150, 180, 210, 240, _
270, 300, 330, 0, 30, 60, 90, 120, 150, 180, 210, 240, 270, 300, 330}
' Magnitude and direction of the vectors
Dim magnitude() As Double = {5, 5, 5, 5, 5, 5, 5, 5, 5, 5, 5, 5, 4, 4, 4, 4, 4, _
4, 4, 4, 4, 4, 4, 4, 3, 3, 3, 3, 3, 3, 3, 3, 3, 3, 3, 3, 2, 2, 2, 2, 2, 2, _
2, 2, 2, 2, 2, 2, 1, 1, 1, 1, 1, 1, 1, 1, 1, 1, 1, 1}
Dim direction() As Double = {60, 90, 120, 150, 180, 210, 240, 270, 300, 330, 0, _
30, 60, 90, 120, 150, 180, 210, 240, 270, 300, 330, 0, 30, 60, 90, 120, _
150, 180, 210, 240, 270, 300, 330, 0, 30, 60, 90, 120, 150, 180, 210, 240, _
270, 300, 330, 0, 30, 60, 90, 120, 150, 180, 210, 240, 270, 300, 330, 0, 30}
' Create a PolarChart object of size 460 x 460 pixels
Dim c As PolarChart = New PolarChart(460, 460)
' Add a title to the chart at the top left corner using 15pts Arial Bold Italic
' font
c.addTitle("Polar Vector Chart Demonstration", "Arial Bold Italic", 15)
' Set center of plot area at (230, 240) with radius 180 pixels
c.setPlotArea(230, 240, 180)
' Set the grid style to circular grid
c.setGridStyle(False)
' Set angular axis as 0 - 360, with a spoke every 30 units
c.angularAxis().setLinearScale(0, 360, 30)
' Add a polar vector layer to the chart with blue (0000ff) vectors
c.addVectorLayer(radius, angle, magnitude, direction, Chart.RadialAxisScale, _
&H0000ff)
' Output the chart
WebChartViewer1.Image = c.makeWebImage(Chart.PNG)
' Include tool tip for the chart
WebChartViewer1.ImageMap = c.getHTMLImageMap("", "", _
"title='Vector at ({value}, {angle} deg): Length = {len}, Angle = {dir} deg'")
End Sub
</script>
<html>
<body>
<chart:WebChartViewer id="WebChartViewer1" runat="server" />
</body>
</html> |