<%@ Page Language="VB" Debug="true" %>
<%@ Import Namespace="ChartDirector" %>
<%@ Register TagPrefix="chart" Namespace="ChartDirector" Assembly="netchartdir" %>
<script runat="server">
'
' Page Load event handler
'
Protected Sub Page_Load(ByVal sender As System.Object, ByVal e As System.EventArgs)
'
' Sample data for the HLOC chart.
'
Dim highData() As Double = {2043, 2039, 2076, 2064, 2048, 2058, 2070, 2033, _
2027, 2029, 2071, 2085, 2034, 2031, 2056, 2128, 2180, 2183, 2192, 2213, _
2230, 2281, 2272}
Dim lowData() As Double = {1931, 1921, 1985, 2028, 1986, 1994, 1999, 1958, _
1943, 1944, 1962, 2011, 1975, 1962, 1928, 2059, 2112, 2103, 2151, 2127, _
2123, 2152, 2212}
Dim openData() As Double = {2000, 1957, 1993, 2037, 2018, 2021, 2045, 2009, _
1959, 1985, 2008, 2048, 2006, 2010, 1971, 2080, 2116, 2137, 2170, 2172, _
2171, 2191, 2240}
Dim closeData() As Double = {1950, 1991, 2026, 2029, 2004, 2053, 2011, 1962, _
1987, 2019, 2040, 2016, 1996, 1985, 2006, 2113, 2142, 2167, 2158, 2201, _
2188, 2231, 2242}
' The labels for the HLOC chart
Dim labels() As String = {"Mon 1", "Tue 2", "Wed 3", "Thu 4", "Fri 5", "Mon 8", _
"Tue 9", "Wed 10", "Thu 11", "Fri 12", "Mon 15", "Tue 16", "Wed 17", _
"Thu 18", "Fri 19", "Mon 22", "Tue 23", "Wed 24", "Thu 25", "Fri 26", _
"Mon 29", "Tue 30", "Wed 31"}
' Create a XYChart object of size 600 x 350 pixels
Dim c As XYChart = New XYChart(600, 350)
' Set the plotarea at (50, 25) and of size 500 x 250 pixels. Enable both the
' horizontal and vertical grids by setting their colors to grey (0xc0c0c0)
c.setPlotArea(50, 25, 500, 250).setGridColor(&Hc0c0c0, &Hc0c0c0)
' Add a title to the chart
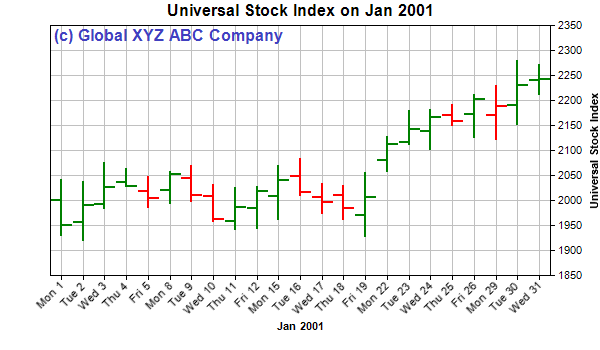
c.addTitle("Universal Stock Index on Jan 2001")
' Add a custom text at (50, 25) (the upper left corner of the plotarea). Use 12
' pts Arial Bold/blue (4040c0) as the font.
c.addText(50, 25, "(c) Global XYZ ABC Company", "Arial Bold", 12, &H4040c0)
' Add a title to the x axis
c.xAxis().setTitle("Jan 2001")
' Set the labels on the x axis. Rotate the labels by 45 degrees.
c.xAxis().setLabels(labels).setFontAngle(45)
' Add a title to the y axis
c.yAxis().setTitle("Universal Stock Index")
' Draw the y axis on the right hand side of the plot area
c.setYAxisOnRight(True)
' Add a HLOC layer to the chart using green (008000) for up days and red (ff0000)
' for down days
Dim layer As HLOCLayer = c.addHLOCLayer3(highData, lowData, openData, _
closeData, &H008000, &Hff0000)
' Set the line width to 2 pixels
layer.setLineWidth(2)
' Output the chart
WebChartViewer1.Image = c.makeWebImage(Chart.PNG)
' Include tool tip for the chart
WebChartViewer1.ImageMap = c.getHTMLImageMap("", "", "title='{xLabel} Jan 2001" _
& vbLf & "High:{high}" & vbLf & "Open:{open}" & vbLf & "Close:{close}" & _
vbLf & "Low:{low}'")
End Sub
</script>
<html>
<body>
<chart:WebChartViewer id="WebChartViewer1" runat="server" />
</body>
</html> |