ChartDirector 5.1 (.NET Edition)

Horizontal Linear Meter


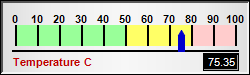
This example demonstrates a simple horizontal linear meter.

A basic linear meter can be created using the following steps:

In addition to the basic linear meter, this example demonstrates the following features:

Source Code Listing

[ASP.NET - VB Version] NetWebCharts\VBNetASP\hlinearmeter.aspx
(Click here on how to convert this code to Visual Studio code-behind style.)
<%@ Page Language="VB" Debug="true" %>
<%@ Import Namespace="ChartDirector" %>
<%@ Register TagPrefix="chart" Namespace="ChartDirector" Assembly="netchartdir" %>
<script runat="server">

'
' Page Load event handler
'
Protected Sub Page_Load(ByVal sender As System.Object, ByVal e As System.EventArgs)

    ' The value to display on the meter
    Dim value As Double = 75.35

    ' Create an LinearMeter object of size 250 x 75 pixels, using silver background
    ' with a 2 pixel black 3D depressed border.
    Dim m As LinearMeter = New LinearMeter(250, 75, Chart.silverColor(), 0, -2)

    ' Set the scale region top-left corner at (15, 25), with size of 200 x 50 pixels.
    ' The scale labels are located on the top (implies horizontal meter)
    m.setMeter(15, 25, 220, 20, Chart.Top)

    ' Set meter scale from 0 - 100, with a tick every 10 units
    m.setScale(0, 100, 10)

    ' Set 0 - 50 as green (99ff99) zone, 50 - 80 as yellow (ffff66) zone, and 80 -
    ' 100 as red (ffcccc) zone
    m.addZone(0, 50, &H99ff99)
    m.addZone(50, 80, &Hffff66)
    m.addZone(80, 100, &Hffcccc)

    ' Add a blue (0000cc) pointer at the specified value
    m.addPointer(value, &H0000cc)

    ' Add a label at bottom-left (10, 68) using Arial Bold/8 pts/red (c00000)
    m.addText(10, 68, "Temperature C", "Arial Bold", 8, &Hc00000, Chart.BottomLeft)

    ' Add a text box to show the value formatted to 2 decimal places at bottom right.
    ' Use white text on black background with a 1 pixel depressed 3D border.
    m.addText(238, 70, m.formatValue(value, "2"), "Arial", 8, &Hffffff, _
        Chart.BottomRight).setBackground(0, 0, -1)

    ' Output the chart
    WebChartViewer1.Image = m.makeWebImage(Chart.PNG)

End Sub

</script>
<html>
<body>
    <chart:WebChartViewer id="WebChartViewer1" runat="server" />
</body>
</html>

[ASP.NET - C# Version] NetWebCharts\CSharpASP\hlinearmeter.aspx
(Click here on how to convert this code to Visual Studio code-behind style.)
<%@ Page Language="C#" Debug="true" %>
<%@ Import Namespace="ChartDirector" %>
<%@ Register TagPrefix="chart" Namespace="ChartDirector" Assembly="netchartdir" %>
<script runat="server">

//
// Page Load event handler
//
protected void Page_Load(object sender, EventArgs e)
{
    // The value to display on the meter
    double value = 75.35;

    // Create an LinearMeter object of size 250 x 75 pixels, using silver background
    // with a 2 pixel black 3D depressed border.
    LinearMeter m = new LinearMeter(250, 75, Chart.silverColor(), 0, -2);

    // Set the scale region top-left corner at (15, 25), with size of 200 x 50
    // pixels. The scale labels are located on the top (implies horizontal meter)
    m.setMeter(15, 25, 220, 20, Chart.Top);

    // Set meter scale from 0 - 100, with a tick every 10 units
    m.setScale(0, 100, 10);

    // Set 0 - 50 as green (99ff99) zone, 50 - 80 as yellow (ffff66) zone, and 80 -
    // 100 as red (ffcccc) zone
    m.addZone(0, 50, 0x99ff99);
    m.addZone(50, 80, 0xffff66);
    m.addZone(80, 100, 0xffcccc);

    // Add a blue (0000cc) pointer at the specified value
    m.addPointer(value, 0x0000cc);

    // Add a label at bottom-left (10, 68) using Arial Bold/8 pts/red (c00000)
    m.addText(10, 68, "Temperature C", "Arial Bold", 8, 0xc00000, Chart.BottomLeft);

    // Add a text box to show the value formatted to 2 decimal places at bottom
    // right. Use white text on black background with a 1 pixel depressed 3D border.
    m.addText(238, 70, m.formatValue(value, "2"), "Arial", 8, 0xffffff,
        Chart.BottomRight).setBackground(0, 0, -1);

    // Output the chart
    WebChartViewer1.Image = m.makeWebImage(Chart.PNG);
}

</script>
<html>
<body>
    <chart:WebChartViewer id="WebChartViewer1" runat="server" />
</body>
</html>

[Windows Forms - VB Version] NetWinCharts\VBNetWinCharts\hlinearmeter.vb
Imports System
Imports Microsoft.VisualBasic
Imports ChartDirector

Public Class hlinearmeter
    Implements DemoModule

    'Name of demo module
    Public Function getName() As String Implements DemoModule.getName
        Return "Horizontal Linear Meter"
    End Function

    'Number of charts produced in this demo module
    Public Function getNoOfCharts() As Integer Implements DemoModule.getNoOfCharts
        Return 1
    End Function

    'Main code for creating chart.
    'Note: the argument img is unused because this demo only has 1 chart.
    Public Sub createChart(viewer As WinChartViewer, img As String) _
        Implements DemoModule.createChart

        ' The value to display on the meter
        Dim value As Double = 75.35

        ' Create an LinearMeter object of size 250 x 75 pixels, using silver
        ' background with a 2 pixel black 3D depressed border.
        Dim m As LinearMeter = New LinearMeter(250, 75, Chart.silverColor(), 0, -2)

        ' Set the scale region top-left corner at (15, 25), with size of 200 x 50
        ' pixels. The scale labels are located on the top (implies horizontal meter)
        m.setMeter(15, 25, 220, 20, Chart.Top)

        ' Set meter scale from 0 - 100, with a tick every 10 units
        m.setScale(0, 100, 10)

        ' Set 0 - 50 as green (99ff99) zone, 50 - 80 as yellow (ffff66) zone, and 80
        ' - 100 as red (ffcccc) zone
        m.addZone(0, 50, &H99ff99)
        m.addZone(50, 80, &Hffff66)
        m.addZone(80, 100, &Hffcccc)

        ' Add a blue (0000cc) pointer at the specified value
        m.addPointer(value, &H0000cc)

        ' Add a label at bottom-left (10, 68) using Arial Bold/8 pts/red (c00000)
        m.addText(10, 68, "Temperature C", "Arial Bold", 8, &Hc00000, _
            Chart.BottomLeft)

        ' Add a text box to show the value formatted to 2 decimal places at bottom
        ' right. Use white text on black background with a 1 pixel depressed 3D
        ' border.
        m.addText(238, 70, m.formatValue(value, "2"), "Arial", 8, &Hffffff, _
            Chart.BottomRight).setBackground(0, 0, -1)

        ' Output the chart
        viewer.Chart = m

    End Sub

End Class

[Windows Forms - C# Version] NetWinCharts\CSharpWinCharts\hlinearmeter.cs
using System;
using ChartDirector;

namespace CSharpChartExplorer
{
    public class hlinearmeter : DemoModule
    {
        //Name of demo module
        public string getName() { return "Horizontal Linear Meter"; }

        //Number of charts produced in this demo module
        public int getNoOfCharts() { return 1; }

        //Main code for creating chart.
        //Note: the argument img is unused because this demo only has 1 chart.
        public void createChart(WinChartViewer viewer, string img)
        {
            // The value to display on the meter
            double value = 75.35;

            // Create an LinearMeter object of size 250 x 75 pixels, using silver
            // background with a 2 pixel black 3D depressed border.
            LinearMeter m = new LinearMeter(250, 75, Chart.silverColor(), 0, -2);

            // Set the scale region top-left corner at (15, 25), with size of 200 x
            // 50 pixels. The scale labels are located on the top (implies horizontal
            // meter)
            m.setMeter(15, 25, 220, 20, Chart.Top);

            // Set meter scale from 0 - 100, with a tick every 10 units
            m.setScale(0, 100, 10);

            // Set 0 - 50 as green (99ff99) zone, 50 - 80 as yellow (ffff66) zone,
            // and 80 - 100 as red (ffcccc) zone
            m.addZone(0, 50, 0x99ff99);
            m.addZone(50, 80, 0xffff66);
            m.addZone(80, 100, 0xffcccc);

            // Add a blue (0000cc) pointer at the specified value
            m.addPointer(value, 0x0000cc);

            // Add a label at bottom-left (10, 68) using Arial Bold/8 pts/red
            // (c00000)
            m.addText(10, 68, "Temperature C", "Arial Bold", 8, 0xc00000,
                Chart.BottomLeft);

            // Add a text box to show the value formatted to 2 decimal places at
            // bottom right. Use white text on black background with a 1 pixel
            // depressed 3D border.
            m.addText(238, 70, m.formatValue(value, "2"), "Arial", 8, 0xffffff,
                Chart.BottomRight).setBackground(0, 0, -1);

            // Output the chart
            viewer.Chart = m;
        }
    }
}