ChartDirector 5.1 (.NET Edition)

Glass Bar Shading


This example demonstrates using glass shading effect for bars and gradient color for plot area background. It also demonstrates axis labels on both sides of the plot area.

Glass lighting is a complex shading effect that gives a look and feel of tinted glass or semi-transparent plastic material. This effect involves glare and variation of lighting caused by reflection and refraction inside the material.

Source Code Listing

[ASP.NET - VB Version] NetWebCharts\VBNetASP\glasslightbar.aspx
(Click here on how to convert this code to Visual Studio code-behind style.)
<%@ Page Language="VB" Debug="true" %>
<%@ Import Namespace="ChartDirector" %>
<%@ Register TagPrefix="chart" Namespace="ChartDirector" Assembly="netchartdir" %>
<script runat="server">

'
' Page Load event handler
'
Protected Sub Page_Load(ByVal sender As System.Object, ByVal e As System.EventArgs)

    ' The data for the bar chart
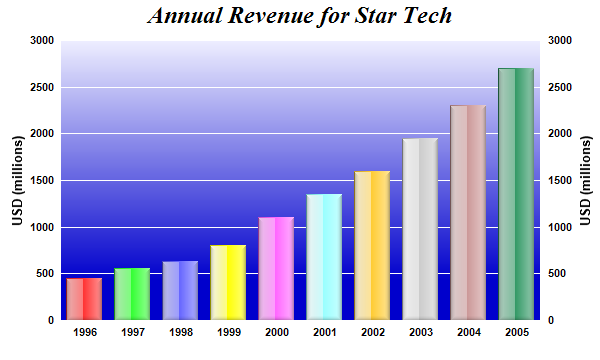
    Dim data() As Double = {450, 560, 630, 800, 1100, 1350, 1600, 1950, 2300, 2700}

    ' The labels for the bar chart
    Dim labels() As String = {"1996", "1997", "1998", "1999", "2000", "2001", _
        "2002", "2003", "2004", "2005"}

    ' Create a XYChart object of size 600 x 360 pixels
    Dim c As XYChart = New XYChart(600, 360)

    ' Set the plotarea at (60, 40) and of size 480 x 280 pixels. Use a vertical
    ' gradient color from light blue (eeeeff) to deep blue (0000cc) as background.
    ' Set border and grid lines to white (ffffff).
    c.setPlotArea(60, 40, 480, 280, c.linearGradientColor(60, 40, 60, 280, _
        &Heeeeff, &H0000cc), -1, &Hffffff, &Hffffff)

    ' Add a title to the chart using 18pts Times Bold Italic font
    c.addTitle("Annual Revenue for Star Tech", "Times New Roman Bold Italic", 18)

    ' Add a multi-color bar chart layer using the supplied data. Use glass lighting
    ' effect with light direction from the left.
    c.addBarLayer3(data).setBorderColor(Chart.Transparent, Chart.glassEffect( _
        Chart.NormalGlare, Chart.Left))

    ' Set the x axis labels
    c.xAxis().setLabels(labels)

    ' Show the same scale on the left and right y-axes
    c.syncYAxis()

    ' Set the left y-axis and right y-axis title using 10pt Arial Bold font
    c.yAxis().setTitle("USD (millions)", "Arial Bold", 10)
    c.yAxis2().setTitle("USD (millions)", "Arial Bold", 10)

    ' Set all axes to transparent
    c.xAxis().setColors(Chart.Transparent)
    c.yAxis().setColors(Chart.Transparent)
    c.yAxis2().setColors(Chart.Transparent)

    ' Set the label styles of all axes to 8pt Arial Bold font
    c.xAxis().setLabelStyle("Arial Bold", 8)
    c.yAxis().setLabelStyle("Arial Bold", 8)
    c.yAxis2().setLabelStyle("Arial Bold", 8)

    ' Output the chart
    WebChartViewer1.Image = c.makeWebImage(Chart.PNG)

    ' Include tool tip for the chart
    WebChartViewer1.ImageMap = c.getHTMLImageMap("", "", _
        "title='Year {xLabel}: US$ {value}M'")

End Sub

</script>
<html>
<body>
    <chart:WebChartViewer id="WebChartViewer1" runat="server" />
</body>
</html>

[ASP.NET - C# Version] NetWebCharts\CSharpASP\glasslightbar.aspx
(Click here on how to convert this code to Visual Studio code-behind style.)
<%@ Page Language="C#" Debug="true" %>
<%@ Import Namespace="ChartDirector" %>
<%@ Register TagPrefix="chart" Namespace="ChartDirector" Assembly="netchartdir" %>
<script runat="server">

//
// Page Load event handler
//
protected void Page_Load(object sender, EventArgs e)
{
    // The data for the bar chart
    double[] data = {450, 560, 630, 800, 1100, 1350, 1600, 1950, 2300, 2700};

    // The labels for the bar chart
    string[] labels = {"1996", "1997", "1998", "1999", "2000", "2001", "2002",
        "2003", "2004", "2005"};

    // Create a XYChart object of size 600 x 360 pixels
    XYChart c = new XYChart(600, 360);

    // Set the plotarea at (60, 40) and of size 480 x 280 pixels. Use a vertical
    // gradient color from light blue (eeeeff) to deep blue (0000cc) as background.
    // Set border and grid lines to white (ffffff).
    c.setPlotArea(60, 40, 480, 280, c.linearGradientColor(60, 40, 60, 280, 0xeeeeff,
        0x0000cc), -1, 0xffffff, 0xffffff);

    // Add a title to the chart using 18pts Times Bold Italic font
    c.addTitle("Annual Revenue for Star Tech", "Times New Roman Bold Italic", 18);

    // Add a multi-color bar chart layer using the supplied data. Use glass lighting
    // effect with light direction from the left.
    c.addBarLayer3(data).setBorderColor(Chart.Transparent, Chart.glassEffect(
        Chart.NormalGlare, Chart.Left));

    // Set the x axis labels
    c.xAxis().setLabels(labels);

    // Show the same scale on the left and right y-axes
    c.syncYAxis();

    // Set the left y-axis and right y-axis title using 10pt Arial Bold font
    c.yAxis().setTitle("USD (millions)", "Arial Bold", 10);
    c.yAxis2().setTitle("USD (millions)", "Arial Bold", 10);

    // Set all axes to transparent
    c.xAxis().setColors(Chart.Transparent);
    c.yAxis().setColors(Chart.Transparent);
    c.yAxis2().setColors(Chart.Transparent);

    // Set the label styles of all axes to 8pt Arial Bold font
    c.xAxis().setLabelStyle("Arial Bold", 8);
    c.yAxis().setLabelStyle("Arial Bold", 8);
    c.yAxis2().setLabelStyle("Arial Bold", 8);

    // Output the chart
    WebChartViewer1.Image = c.makeWebImage(Chart.PNG);

    // Include tool tip for the chart
    WebChartViewer1.ImageMap = c.getHTMLImageMap("", "",
        "title='Year {xLabel}: US$ {value}M'");
}

</script>
<html>
<body>
    <chart:WebChartViewer id="WebChartViewer1" runat="server" />
</body>
</html>

[Windows Forms - VB Version] NetWinCharts\VBNetWinCharts\glasslightbar.vb
Imports System
Imports Microsoft.VisualBasic
Imports ChartDirector

Public Class glasslightbar
    Implements DemoModule

    'Name of demo module
    Public Function getName() As String Implements DemoModule.getName
        Return "Glass Bar Shading"
    End Function

    'Number of charts produced in this demo module
    Public Function getNoOfCharts() As Integer Implements DemoModule.getNoOfCharts
        Return 1
    End Function

    'Main code for creating chart.
    'Note: the argument img is unused because this demo only has 1 chart.
    Public Sub createChart(viewer As WinChartViewer, img As String) _
        Implements DemoModule.createChart

        ' The data for the bar chart
        Dim data() As Double = {450, 560, 630, 800, 1100, 1350, 1600, 1950, 2300, _
            2700}

        ' The labels for the bar chart
        Dim labels() As String = {"1996", "1997", "1998", "1999", "2000", "2001", _
            "2002", "2003", "2004", "2005"}

        ' Create a XYChart object of size 600 x 360 pixels
        Dim c As XYChart = New XYChart(600, 360)

        ' Set the plotarea at (60, 40) and of size 480 x 280 pixels. Use a vertical
        ' gradient color from light blue (eeeeff) to deep blue (0000cc) as
        ' background. Set border and grid lines to white (ffffff).
        c.setPlotArea(60, 40, 480, 280, c.linearGradientColor(60, 40, 60, 280, _
            &Heeeeff, &H0000cc), -1, &Hffffff, &Hffffff)

        ' Add a title to the chart using 18pts Times Bold Italic font
        c.addTitle("Annual Revenue for Star Tech", "Times New Roman Bold Italic", _
            18)

        ' Add a multi-color bar chart layer using the supplied data. Use glass
        ' lighting effect with light direction from the left.
        c.addBarLayer3(data).setBorderColor(Chart.Transparent, Chart.glassEffect( _
            Chart.NormalGlare, Chart.Left))

        ' Set the x axis labels
        c.xAxis().setLabels(labels)

        ' Show the same scale on the left and right y-axes
        c.syncYAxis()

        ' Set the left y-axis and right y-axis title using 10pt Arial Bold font
        c.yAxis().setTitle("USD (millions)", "Arial Bold", 10)
        c.yAxis2().setTitle("USD (millions)", "Arial Bold", 10)

        ' Set all axes to transparent
        c.xAxis().setColors(Chart.Transparent)
        c.yAxis().setColors(Chart.Transparent)
        c.yAxis2().setColors(Chart.Transparent)

        ' Set the label styles of all axes to 8pt Arial Bold font
        c.xAxis().setLabelStyle("Arial Bold", 8)
        c.yAxis().setLabelStyle("Arial Bold", 8)
        c.yAxis2().setLabelStyle("Arial Bold", 8)

        ' Output the chart
        viewer.Chart = c

        'include tool tip for the chart
        viewer.ImageMap = c.getHTMLImageMap("clickable", "", _
            "title='Year {xLabel}: US$ {value}M'")

    End Sub

End Class

[Windows Forms - C# Version] NetWinCharts\CSharpWinCharts\glasslightbar.cs
using System;
using ChartDirector;

namespace CSharpChartExplorer
{
    public class glasslightbar : DemoModule
    {
        //Name of demo module
        public string getName() { return "Glass Bar Shading"; }

        //Number of charts produced in this demo module
        public int getNoOfCharts() { return 1; }

        //Main code for creating chart.
        //Note: the argument img is unused because this demo only has 1 chart.
        public void createChart(WinChartViewer viewer, string img)
        {
            // The data for the bar chart
            double[] data = {450, 560, 630, 800, 1100, 1350, 1600, 1950, 2300, 2700};

            // The labels for the bar chart
            string[] labels = {"1996", "1997", "1998", "1999", "2000", "2001",
                "2002", "2003", "2004", "2005"};

            // Create a XYChart object of size 600 x 360 pixels
            XYChart c = new XYChart(600, 360);

            // Set the plotarea at (60, 40) and of size 480 x 280 pixels. Use a
            // vertical gradient color from light blue (eeeeff) to deep blue (0000cc)
            // as background. Set border and grid lines to white (ffffff).
            c.setPlotArea(60, 40, 480, 280, c.linearGradientColor(60, 40, 60, 280,
                0xeeeeff, 0x0000cc), -1, 0xffffff, 0xffffff);

            // Add a title to the chart using 18pts Times Bold Italic font
            c.addTitle("Annual Revenue for Star Tech", "Times New Roman Bold Italic",
                18);

            // Add a multi-color bar chart layer using the supplied data. Use glass
            // lighting effect with light direction from the left.
            c.addBarLayer3(data).setBorderColor(Chart.Transparent, Chart.glassEffect(
                Chart.NormalGlare, Chart.Left));

            // Set the x axis labels
            c.xAxis().setLabels(labels);

            // Show the same scale on the left and right y-axes
            c.syncYAxis();

            // Set the left y-axis and right y-axis title using 10pt Arial Bold font
            c.yAxis().setTitle("USD (millions)", "Arial Bold", 10);
            c.yAxis2().setTitle("USD (millions)", "Arial Bold", 10);

            // Set all axes to transparent
            c.xAxis().setColors(Chart.Transparent);
            c.yAxis().setColors(Chart.Transparent);
            c.yAxis2().setColors(Chart.Transparent);

            // Set the label styles of all axes to 8pt Arial Bold font
            c.xAxis().setLabelStyle("Arial Bold", 8);
            c.yAxis().setLabelStyle("Arial Bold", 8);
            c.yAxis2().setLabelStyle("Arial Bold", 8);

            // Output the chart
            viewer.Chart = c;

            //include tool tip for the chart
            viewer.ImageMap = c.getHTMLImageMap("clickable", "",
                "title='Year {xLabel}: US$ {value}M'");
        }
    }
}