ChartDirector 5.1 (.NET Edition)

Donut Chart


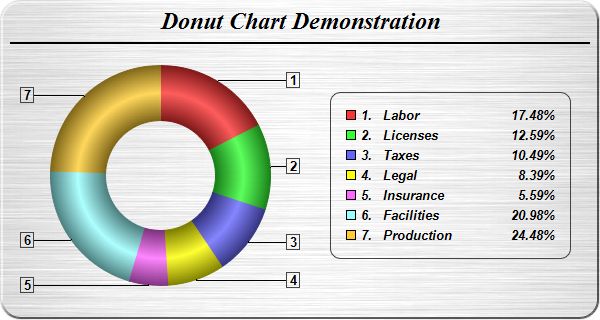
This example demonstrates a donut chart with ring shading effects. It also demonstrates brushed metal background, rounded frame, customized sector labels and using CDML and Parameter Substitution and Formatting to format legend text.

Source Code Listing

[ASP.NET - VB Version] NetWebCharts\VBNetASP\donut.aspx
(Click here on how to convert this code to Visual Studio code-behind style.)
<%@ Page Language="VB" Debug="true" %>
<%@ Import Namespace="ChartDirector" %>
<%@ Register TagPrefix="chart" Namespace="ChartDirector" Assembly="netchartdir" %>
<script runat="server">

'
' Page Load event handler
'
Protected Sub Page_Load(ByVal sender As System.Object, ByVal e As System.EventArgs)

    ' The data for the pie chart
    Dim data() As Double = {25, 18, 15, 12, 8, 30, 35}

    ' The labels for the pie chart
    Dim labels() As String = {"Labor", "Licenses", "Taxes", "Legal", "Insurance", _
        "Facilities", "Production"}

    ' Create a PieChart object of size 600 x 320 pixels. Set background color to
    ' brushed silver, with a 2 pixel 3D border. Use rounded corners of 20 pixels
    ' radius.
    Dim c As PieChart = New PieChart(600, 320, Chart.brushedSilverColor(), _
        Chart.Transparent, 2)
    c.setRoundedFrame(&Hffffff, 20)

    ' Add a title using 18 pts Times New Roman Bold Italic font. #Set top/bottom
    ' margins to 8 pixels.
    Dim title As ChartDirector.TextBox = c.addTitle("Donut Chart Demonstration", _
        "Times New Roman Bold Italic", 18)
    title.setMargin2(0, 0, 8, 8)

    ' Add a 2 pixels wide separator line just under the title
    c.addLine(10, title.getHeight(), c.getWidth() - 11, title.getHeight(), _
        Chart.LineColor, 2)

    ' Set donut center at (160, 175), and outer/inner radii as 110/55 pixels
    c.setDonutSize(160, 175, 110, 55)

    ' Set the pie data and the pie labels
    c.setData(data, labels)

    ' Use ring shading effect for the sectors
    c.setSectorStyle(Chart.RingShading)

    ' Use the side label layout method, with the labels positioned 16 pixels from the
    ' donut bounding box
    c.setLabelLayout(Chart.SideLayout, 16)

    ' Show only the sector number as the sector label
    c.setLabelFormat("{={sector}+1}")

    ' Set the sector label style to Arial Bold 10pt, with a dark grey (444444) border
    c.setLabelStyle("Arial Bold", 10).setBackground(Chart.Transparent, &H444444)

    ' Add a legend box, with the center of the left side anchored at (330, 175), and
    ' using 10 pts Arial Bold Italic font
    Dim b As LegendBox = c.addLegend(330, 175, True, "Arial Bold Italic", 10)
    b.setAlignment(Chart.Left)

    ' Set the legend box border to dark grey (444444), and with rounded conerns
    b.setBackground(Chart.Transparent, &H444444)
    b.setRoundedCorners()

    ' Set the legend box margin to 16 pixels, and the extra line spacing between the
    ' legend entries as 5 pixels
    b.setMargin(16)
    b.setKeySpacing(0, 5)

    ' Set the legend text to show the sector number, followed by a 120 pixels wide
    ' block showing the sector label, and a 40 pixels wide block showing the
    ' percentage
    b.setText( _
        "<*block,valign=top*>{={sector}+1}.<*advanceTo=22*><*block,width=120*>" & _
        "{label}<*/*><*block,width=40,halign=right*>{percent}<*/*>%")

    ' Output the chart
    WebChartViewer1.Image = c.makeWebImage(Chart.JPG)

    ' Include tool tip for the chart
    WebChartViewer1.ImageMap = c.getHTMLImageMap("", "", _
        "title='{label}: US${value}K ({percent}%)'")

End Sub

</script>
<html>
<body>
    <chart:WebChartViewer id="WebChartViewer1" runat="server" />
</body>
</html>

[ASP.NET - C# Version] NetWebCharts\CSharpASP\donut.aspx
(Click here on how to convert this code to Visual Studio code-behind style.)
<%@ Page Language="C#" Debug="true" %>
<%@ Import Namespace="ChartDirector" %>
<%@ Register TagPrefix="chart" Namespace="ChartDirector" Assembly="netchartdir" %>
<script runat="server">

//
// Page Load event handler
//
protected void Page_Load(object sender, EventArgs e)
{
    // The data for the pie chart
    double[] data = {25, 18, 15, 12, 8, 30, 35};

    // The labels for the pie chart
    string[] labels = {"Labor", "Licenses", "Taxes", "Legal", "Insurance",
        "Facilities", "Production"};

    // Create a PieChart object of size 600 x 320 pixels. Set background color to
    // brushed silver, with a 2 pixel 3D border. Use rounded corners of 20 pixels
    // radius.
    PieChart c = new PieChart(600, 320, Chart.brushedSilverColor(),
        Chart.Transparent, 2);
    c.setRoundedFrame(0xffffff, 20);

    // Add a title using 18 pts Times New Roman Bold Italic font. #Set top/bottom
    // margins to 8 pixels.
    ChartDirector.TextBox title = c.addTitle("Donut Chart Demonstration",
        "Times New Roman Bold Italic", 18);
    title.setMargin2(0, 0, 8, 8);

    // Add a 2 pixels wide separator line just under the title
    c.addLine(10, title.getHeight(), c.getWidth() - 11, title.getHeight(),
        Chart.LineColor, 2);

    // Set donut center at (160, 175), and outer/inner radii as 110/55 pixels
    c.setDonutSize(160, 175, 110, 55);

    // Set the pie data and the pie labels
    c.setData(data, labels);

    // Use ring shading effect for the sectors
    c.setSectorStyle(Chart.RingShading);

    // Use the side label layout method, with the labels positioned 16 pixels from
    // the donut bounding box
    c.setLabelLayout(Chart.SideLayout, 16);

    // Show only the sector number as the sector label
    c.setLabelFormat("{={sector}+1}");

    // Set the sector label style to Arial Bold 10pt, with a dark grey (444444)
    // border
    c.setLabelStyle("Arial Bold", 10).setBackground(Chart.Transparent, 0x444444);

    // Add a legend box, with the center of the left side anchored at (330, 175), and
    // using 10 pts Arial Bold Italic font
    LegendBox b = c.addLegend(330, 175, true, "Arial Bold Italic", 10);
    b.setAlignment(Chart.Left);

    // Set the legend box border to dark grey (444444), and with rounded conerns
    b.setBackground(Chart.Transparent, 0x444444);
    b.setRoundedCorners();

    // Set the legend box margin to 16 pixels, and the extra line spacing between the
    // legend entries as 5 pixels
    b.setMargin(16);
    b.setKeySpacing(0, 5);

    // Set the legend text to show the sector number, followed by a 120 pixels wide
    // block showing the sector label, and a 40 pixels wide block showing the
    // percentage
    b.setText(
        "<*block,valign=top*>{={sector}+1}.<*advanceTo=22*><*block,width=120*>" +
        "{label}<*/*><*block,width=40,halign=right*>{percent}<*/*>%");

    // Output the chart
    WebChartViewer1.Image = c.makeWebImage(Chart.JPG);

    // Include tool tip for the chart
    WebChartViewer1.ImageMap = c.getHTMLImageMap("", "",
        "title='{label}: US${value}K ({percent}%)'");
}

</script>
<html>
<body>
    <chart:WebChartViewer id="WebChartViewer1" runat="server" />
</body>
</html>

[Windows Forms - VB Version] NetWinCharts\VBNetWinCharts\donut.vb
Imports System
Imports Microsoft.VisualBasic
Imports ChartDirector

Public Class donut
    Implements DemoModule

    'Name of demo module
    Public Function getName() As String Implements DemoModule.getName
        Return "Donut Chart"
    End Function

    'Number of charts produced in this demo module
    Public Function getNoOfCharts() As Integer Implements DemoModule.getNoOfCharts
        Return 1
    End Function

    'Main code for creating chart.
    'Note: the argument img is unused because this demo only has 1 chart.
    Public Sub createChart(viewer As WinChartViewer, img As String) _
        Implements DemoModule.createChart

        ' The data for the pie chart
        Dim data() As Double = {25, 18, 15, 12, 8, 30, 35}

        ' The labels for the pie chart
        Dim labels() As String = {"Labor", "Licenses", "Taxes", "Legal", _
            "Insurance", "Facilities", "Production"}

        ' Create a PieChart object of size 600 x 320 pixels. Set background color to
        ' brushed silver, with a 2 pixel 3D border. Use rounded corners of 20 pixels
        ' radius.
        Dim c As PieChart = New PieChart(600, 320, Chart.brushedSilverColor(), _
            Chart.Transparent, 2)
        c.setRoundedFrame(&Hffffff, 20)

        ' Add a title using 18 pts Times New Roman Bold Italic font. #Set top/bottom
        ' margins to 8 pixels.
        Dim title As ChartDirector.TextBox = c.addTitle( _
            "Donut Chart Demonstration", "Times New Roman Bold Italic", 18)
        title.setMargin2(0, 0, 8, 8)

        ' Add a 2 pixels wide separator line just under the title
        c.addLine(10, title.getHeight(), c.getWidth() - 11, title.getHeight(), _
            Chart.LineColor, 2)

        ' Set donut center at (160, 175), and outer/inner radii as 110/55 pixels
        c.setDonutSize(160, 175, 110, 55)

        ' Set the pie data and the pie labels
        c.setData(data, labels)

        ' Use ring shading effect for the sectors
        c.setSectorStyle(Chart.RingShading)

        ' Use the side label layout method, with the labels positioned 16 pixels from
        ' the donut bounding box
        c.setLabelLayout(Chart.SideLayout, 16)

        ' Show only the sector number as the sector label
        c.setLabelFormat("{={sector}+1}")

        ' Set the sector label style to Arial Bold 10pt, with a dark grey (444444)
        ' border
        c.setLabelStyle("Arial Bold", 10).setBackground(Chart.Transparent, &H444444)

        ' Add a legend box, with the center of the left side anchored at (330, 175),
        ' and using 10 pts Arial Bold Italic font
        Dim b As LegendBox = c.addLegend(330, 175, True, "Arial Bold Italic", 10)
        b.setAlignment(Chart.Left)

        ' Set the legend box border to dark grey (444444), and with rounded conerns
        b.setBackground(Chart.Transparent, &H444444)
        b.setRoundedCorners()

        ' Set the legend box margin to 16 pixels, and the extra line spacing between
        ' the legend entries as 5 pixels
        b.setMargin(16)
        b.setKeySpacing(0, 5)

        ' Set the legend text to show the sector number, followed by a 120 pixels
        ' wide block showing the sector label, and a 40 pixels wide block showing the
        ' percentage
        b.setText( _
            "<*block,valign=top*>{={sector}+1}.<*advanceTo=22*>" & _
            "<*block,width=120*>{label}<*/*><*block,width=40,halign=right*>" & _
            "{percent}<*/*>%")

        ' Output the chart
        viewer.Chart = c

        'include tool tip for the chart
        viewer.ImageMap = c.getHTMLImageMap("clickable", "", _
            "title='{label}: US${value}K ({percent}%)'")

    End Sub

End Class

[Windows Forms - C# Version] NetWinCharts\CSharpWinCharts\donut.cs
using System;
using ChartDirector;

namespace CSharpChartExplorer
{
    public class donut : DemoModule
    {
        //Name of demo module
        public string getName() { return "Donut Chart"; }

        //Number of charts produced in this demo module
        public int getNoOfCharts() { return 1; }

        //Main code for creating chart.
        //Note: the argument img is unused because this demo only has 1 chart.
        public void createChart(WinChartViewer viewer, string img)
        {
            // The data for the pie chart
            double[] data = {25, 18, 15, 12, 8, 30, 35};

            // The labels for the pie chart
            string[] labels = {"Labor", "Licenses", "Taxes", "Legal", "Insurance",
                "Facilities", "Production"};

            // Create a PieChart object of size 600 x 320 pixels. Set background
            // color to brushed silver, with a 2 pixel 3D border. Use rounded corners
            // of 20 pixels radius.
            PieChart c = new PieChart(600, 320, Chart.brushedSilverColor(),
                Chart.Transparent, 2);
            c.setRoundedFrame(0xffffff, 20);

            // Add a title using 18 pts Times New Roman Bold Italic font. #Set
            // top/bottom margins to 8 pixels.
            ChartDirector.TextBox title = c.addTitle("Donut Chart Demonstration",
                "Times New Roman Bold Italic", 18);
            title.setMargin2(0, 0, 8, 8);

            // Add a 2 pixels wide separator line just under the title
            c.addLine(10, title.getHeight(), c.getWidth() - 11, title.getHeight(),
                Chart.LineColor, 2);

            // Set donut center at (160, 175), and outer/inner radii as 110/55 pixels
            c.setDonutSize(160, 175, 110, 55);

            // Set the pie data and the pie labels
            c.setData(data, labels);

            // Use ring shading effect for the sectors
            c.setSectorStyle(Chart.RingShading);

            // Use the side label layout method, with the labels positioned 16 pixels
            // from the donut bounding box
            c.setLabelLayout(Chart.SideLayout, 16);

            // Show only the sector number as the sector label
            c.setLabelFormat("{={sector}+1}");

            // Set the sector label style to Arial Bold 10pt, with a dark grey
            // (444444) border
            c.setLabelStyle("Arial Bold", 10).setBackground(Chart.Transparent,
                0x444444);

            // Add a legend box, with the center of the left side anchored at (330,
            // 175), and using 10 pts Arial Bold Italic font
            LegendBox b = c.addLegend(330, 175, true, "Arial Bold Italic", 10);
            b.setAlignment(Chart.Left);

            // Set the legend box border to dark grey (444444), and with rounded
            // conerns
            b.setBackground(Chart.Transparent, 0x444444);
            b.setRoundedCorners();

            // Set the legend box margin to 16 pixels, and the extra line spacing
            // between the legend entries as 5 pixels
            b.setMargin(16);
            b.setKeySpacing(0, 5);

            // Set the legend text to show the sector number, followed by a 120
            // pixels wide block showing the sector label, and a 40 pixels wide block
            // showing the percentage
            b.setText(
                "<*block,valign=top*>{={sector}+1}.<*advanceTo=22*>" +
                "<*block,width=120*>{label}<*/*><*block,width=40,halign=right*>" +
                "{percent}<*/*>%");

            // Output the chart
            viewer.Chart = c;

            //include tool tip for the chart
            viewer.ImageMap = c.getHTMLImageMap("clickable", "",
                "title='{label}: US${value}K ({percent}%)'");
        }
    }
}