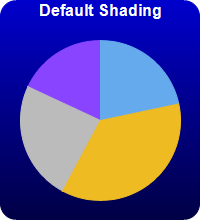
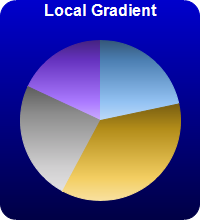
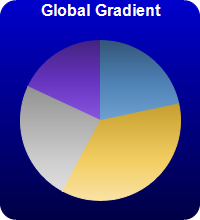

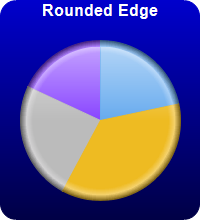
This example demonstrates various sector shading effects applicable to 2D pie charts.
ChartDirector 6.0 (Ruby Edition)
2D Pie Shading
Source Code Listing
require("chartdirector")
class PieshadingController < ApplicationController
def index()
@title = "2D Pie Shading"
@ctrl_file = File.expand_path(__FILE__)
@noOfCharts = 6
render :template => "templates/chartview"
end
#
# Render and deliver the chart
#
def getchart()
# This script can draw different charts depending on the chartIndex
chartIndex = (params["img"]).to_i
# The data for the pie chart
data = [18, 30, 20, 15]
# The colors to use for the sectors
colors = [0x66aaee, 0xeebb22, 0xbbbbbb, 0x8844ff]
# Create a PieChart object of size 200 x 220 pixels. Use a vertical gradient color from blue
# (0000cc) to deep blue (000044) as background. Use rounded corners of 16 pixels radius.
c = ChartDirector::PieChart.new(200, 220)
c.setBackground(c.linearGradientColor(0, 0, 0, c.getHeight(), 0x0000cc, 0x000044))
c.setRoundedFrame(0xffffff, 16)
# Set the center of the pie at (100, 120) and the radius to 80 pixels
c.setPieSize(100, 120, 80)
# Set the pie data
c.setData(data)
# Set the sector colors
c.setColors2(ChartDirector::DataColor, colors)
# Demonstrates various shading modes
if chartIndex == 0
c.addTitle("Default Shading", "bold", 12, 0xffffff)
elsif chartIndex == 1
c.addTitle("Local Gradient", "bold", 12, 0xffffff)
c.setSectorStyle(ChartDirector::LocalGradientShading)
elsif chartIndex == 2
c.addTitle("Global Gradient", "bold", 12, 0xffffff)
c.setSectorStyle(ChartDirector::GlobalGradientShading)
elsif chartIndex == 3
c.addTitle("Concave Shading", "bold", 12, 0xffffff)
c.setSectorStyle(ChartDirector::ConcaveShading)
elsif chartIndex == 4
c.addTitle("Rounded Edge", "bold", 12, 0xffffff)
c.setSectorStyle(ChartDirector::RoundedEdgeShading)
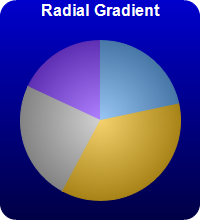
elsif chartIndex == 5
c.addTitle("Radial Gradient", "bold", 12, 0xffffff)
c.setSectorStyle(ChartDirector::RadialShading)
end
# Disable the sector labels by setting the color to Transparent
c.setLabelStyle("", 8, ChartDirector::Transparent)
# Output the chart
send_data(c.makeChart2(ChartDirector::PNG), :type => "image/png", :disposition => "inline")
end
end |
<html>
<body style="margin:5px 0px 0px 5px">

<!-- Title -->
<div style="font-size:18pt; font-family:verdana; font-weight:bold">
    <%= @title %>
</div>
<hr style="border:solid 1px #000080" />

<!-- Source Code Listing Link -->
<div style="font-size:9pt; font-family:verdana; margin-bottom:1.5em">
    <%= link_to "Source Code Listing",
        :controller => "cddemo", :action => "viewsource",
        :ctrl_file => @ctrl_file, :view_file => File.expand_path(__FILE__) %>
</div>

<!-- Create one or more IMG tags to display the demo chart(s) -->
<% 0.upto(@noOfCharts - 1) do |i| %>
    <img src="<%= url_for(:action => "getchart", :img => i) %>">
<% end %>

</body>
</html> |
#!/usr/bin/env ruby
require("chartdirector")

def createChart(chartIndex)

    # The data for the pie chart
    data = [18, 30, 20, 15]

    # The colors to use for the sectors
    colors = [0x66aaee, 0xeebb22, 0xbbbbbb, 0x8844ff]

    # Create a PieChart object of size 200 x 220 pixels. Use a vertical gradient color from blue
    # (0000cc) to deep blue (000044) as background. Use rounded corners of 16 pixels radius.
    c = ChartDirector::PieChart.new(200, 220)
    c.setBackground(c.linearGradientColor(0, 0, 0, c.getHeight(), 0x0000cc, 0x000044))
    c.setRoundedFrame(0xffffff, 16)

    # Set the center of the pie at (100, 120) and the radius to 80 pixels
    c.setPieSize(100, 120, 80)

    # Set the pie data
    c.setData(data)

    # Set the sector colors
    c.setColors2(ChartDirector::DataColor, colors)

    # Demonstrates various shading modes
    if chartIndex == 0
        c.addTitle("Default Shading", "bold", 12, 0xffffff)
    elsif chartIndex == 1
        c.addTitle("Local Gradient", "bold", 12, 0xffffff)
        c.setSectorStyle(ChartDirector::LocalGradientShading)
    elsif chartIndex == 2
        c.addTitle("Global Gradient", "bold", 12, 0xffffff)
        c.setSectorStyle(ChartDirector::GlobalGradientShading)
    elsif chartIndex == 3
        c.addTitle("Concave Shading", "bold", 12, 0xffffff)
        c.setSectorStyle(ChartDirector::ConcaveShading)
    elsif chartIndex == 4
        c.addTitle("Rounded Edge", "bold", 12, 0xffffff)
        c.setSectorStyle(ChartDirector::RoundedEdgeShading)
    elsif chartIndex == 5
        c.addTitle("Radial Gradient", "bold", 12, 0xffffff)
        c.setSectorStyle(ChartDirector::RadialShading)
    end

    # Disable the sector labels by setting the color to Transparent
    c.setLabelStyle("", 8, ChartDirector::Transparent)

    # Output the chart
    c.makeChart("pieshading%s.png" % chartIndex)
end

createChart(0)
createChart(1)
createChart(2)
createChart(3)
createChart(4)
createChart(5) |