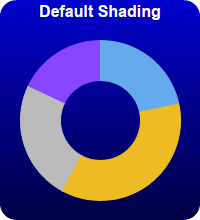
This example demonstrates various sector shading effects applicable to 2D donut charts.
ChartDirector 7.0 (ASP/COM/VB Edition)
2D Donut Shading
Source Code Listing
<%@ language="vbscript" %>
<%
Set cd = CreateObject("ChartDirector.API")
' This script can draw different charts depending on the chartIndex
Sub createChart(viewer, chartIndex)
' The data for the pie chart
data = Array(18, 30, 20, 15)
' The labels for the pie chart
labels = Array("Labor", "Licenses", "Facilities", "Production")
' The colors to use for the sectors
colors = Array(&H66aaee, &Heebb22, &Hbbbbbb, &H8844ff)
' Create a PieChart object of size 200 x 220 pixels. Use a vertical gradient color from blue
' (0000cc) to deep blue (000044) as background. Use rounded corners of 16 pixels radius.
Set c = cd.PieChart(200, 220)
Call c.setBackground(c.linearGradientColor(0, 0, 0, c.getHeight(), &H0000cc, &H000044))
Call c.setRoundedFrame(&Hffffff, 16)
' Set donut center at (100, 120), and outer/inner radii as 80/40 pixels
Call c.setDonutSize(100, 120, 80, 40)
' Set the pie data
Call c.setData(data, labels)
' Set the sector colors
Call c.setColors2(cd.DataColor, colors)
' Demonstrates various shading modes
If chartIndex = 0 Then
Call c.addTitle("Default Shading", "bold", 12, &Hffffff)
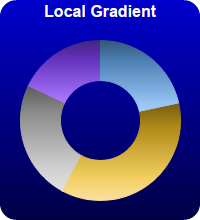
ElseIf chartIndex = 1 Then
Call c.addTitle("Local Gradient", "bold", 12, &Hffffff)
Call c.setSectorStyle(cd.LocalGradientShading)
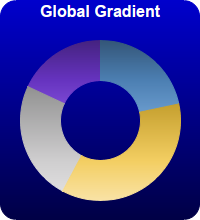
ElseIf chartIndex = 2 Then
Call c.addTitle("Global Gradient", "bold", 12, &Hffffff)
Call c.setSectorStyle(cd.GlobalGradientShading)
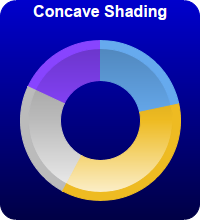
ElseIf chartIndex = 3 Then
Call c.addTitle("Concave Shading", "bold", 12, &Hffffff)
Call c.setSectorStyle(cd.ConcaveShading)
ElseIf chartIndex = 4 Then
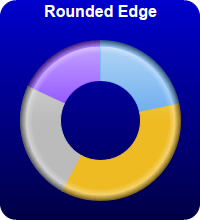
Call c.addTitle("Rounded Edge", "bold", 12, &Hffffff)
Call c.setSectorStyle(cd.RoundedEdgeShading)
ElseIf chartIndex = 5 Then
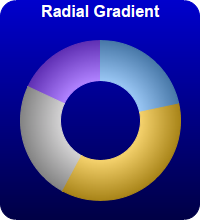
Call c.addTitle("Radial Gradient", "bold", 12, &Hffffff)
Call c.setSectorStyle(cd.RadialShading)
ElseIf chartIndex = 6 Then
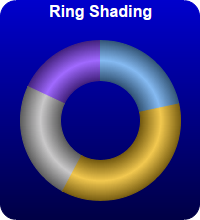
Call c.addTitle("Ring Shading", "bold", 12, &Hffffff)
Call c.setSectorStyle(cd.RingShading)
End If
' Disable the sector labels by setting the color to Transparent
Call c.setLabelStyle("", 8, cd.Transparent)
' Output the chart
Call viewer.setChart(c, cd.SVG)
' Include tool tip for the chart
viewer.ImageMap = c.getHTMLImageMap("", "", "title='{label}: US${value}K ({percent}%)'")
End Sub
' This example includes 7 charts
Dim viewers(6)
For i = 0 To Ubound(viewers)
Set viewers(i) = cd.WebChartViewer(Request, "chart" & i)
Call createChart(viewers(i), i)
Next
%>
<!DOCTYPE html>
<html>
<head>
<title>2D Donut Shading</title>
<!-- Include ChartDirector Javascript Library to support chart interactions -->
<script type="text/javascript" src="cdjcv.js"></script>
</head>
<body style="margin:5px 0px 0px 5px">
<div style="font:bold 18pt verdana;">
2D Donut Shading
</div>
<hr style="border:solid 1px #000080; background:#000080" />
<div style="font:10pt verdana; margin-bottom:1.5em">
<a href="viewsource.asp?file=<%= Request("SCRIPT_NAME") %>">View Chart Source Code</a>
</div>
<!-- ****** Here are the chart images ****** -->
<%
For i = 0 To Ubound(viewers)
Call Response.Write(viewers(i).renderHTML())
Call Response.Write(" ")
Next
%>
</body>
</html>Public Sub createChart(viewer As Object, chartIndex As Integer)
Dim cd As New ChartDirector.API
' The data for the pie chart
Dim data()
data = Array(18, 30, 20, 15)
' The labels for the pie chart
Dim labels()
labels = Array("Labor", "Licenses", "Facilities", "Production")
' The colors to use for the sectors
Dim colors()
colors = Array(&H66aaee, &Heebb22, &Hbbbbbb, &H8844ff)
' Create a PieChart object of size 200 x 220 pixels. Use a vertical gradient color from blue
' (0000cc) to deep blue (000044) as background. Use rounded corners of 16 pixels radius.
Dim c As PieChart
Set c = cd.PieChart(200, 220)
Call c.setBackground(c.linearGradientColor(0, 0, 0, c.getHeight(), &H0000cc, &H000044))
Call c.setRoundedFrame(&Hffffff, 16)
' Set donut center at (100, 120), and outer/inner radii as 80/40 pixels
Call c.setDonutSize(100, 120, 80, 40)
' Set the pie data
Call c.setData(data, labels)
' Set the sector colors
Call c.setColors2(cd.DataColor, colors)
' Demonstrates various shading modes
If chartIndex = 0 Then
Call c.addTitle("Default Shading", "bold", 12, &Hffffff)
ElseIf chartIndex = 1 Then
Call c.addTitle("Local Gradient", "bold", 12, &Hffffff)
Call c.setSectorStyle(cd.LocalGradientShading)
ElseIf chartIndex = 2 Then
Call c.addTitle("Global Gradient", "bold", 12, &Hffffff)
Call c.setSectorStyle(cd.GlobalGradientShading)
ElseIf chartIndex = 3 Then
Call c.addTitle("Concave Shading", "bold", 12, &Hffffff)
Call c.setSectorStyle(cd.ConcaveShading)
ElseIf chartIndex = 4 Then
Call c.addTitle("Rounded Edge", "bold", 12, &Hffffff)
Call c.setSectorStyle(cd.RoundedEdgeShading)
ElseIf chartIndex = 5 Then
Call c.addTitle("Radial Gradient", "bold", 12, &Hffffff)
Call c.setSectorStyle(cd.RadialShading)
ElseIf chartIndex = 6 Then
Call c.addTitle("Ring Shading", "bold", 12, &Hffffff)
Call c.setSectorStyle(cd.RingShading)
End If
' Disable the sector labels by setting the color to Transparent
Call c.setLabelStyle("", 8, cd.Transparent)
' Output the chart
Set viewer.Picture = c.makePicture()
'include tool tip for the chart
viewer.ImageMap = c.getHTMLImageMap("clickable", "", _
"title='{label}: US${value}K ({percent}%)'")
End Sub