<cfscript>
// ChartDirector for ColdFusion API Access Point
cd = CreateObject("java", "ChartDirector.CFChart");
// A utility to allow us to create arrays with data in one line of code
function Array() {
var result = ArrayNew(1);
var i = 0;
for (i = 1; i LTE ArrayLen(arguments); i = i + 1)
result[i] = arguments[i];
return result;
}
// the names of the tasks
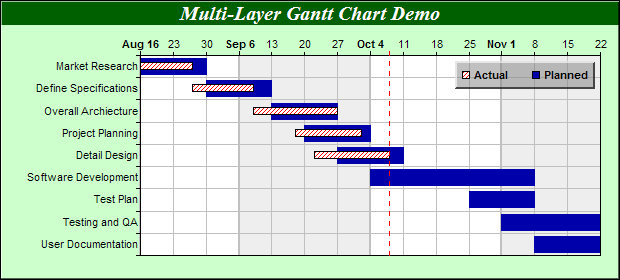
labels = Array("Market Research", "Define Specifications", "Overall Archiecture",
"Project Planning", "Detail Design", "Software Development", "Test Plan", "Testing and QA",
"User Documentation");
// the planned start dates and end dates for the tasks
startDate = Array(CreateDate(2004, 8, 16), CreateDate(2004, 8, 30), CreateDate(2004, 9, 13),
CreateDate(2004, 9, 20), CreateDate(2004, 9, 27), CreateDate(2004, 10, 4), CreateDate(2004, 10,
25), CreateDate(2004, 11, 1), CreateDate(2004, 11, 8));
endDate = Array(CreateDate(2004, 8, 30), CreateDate(2004, 9, 13), CreateDate(2004, 9, 27),
CreateDate(2004, 10, 4), CreateDate(2004, 10, 11), CreateDate(2004, 11, 8), CreateDate(2004, 11,
8), CreateDate(2004, 11, 22), CreateDate(2004, 11, 22));
// the actual start dates and end dates for the tasks up to now
actualStartDate = Array(CreateDate(2004, 8, 16), CreateDate(2004, 8, 27), CreateDate(2004, 9, 9),
CreateDate(2004, 9, 18), CreateDate(2004, 9, 22));
actualEndDate = Array(CreateDate(2004, 8, 27), CreateDate(2004, 9, 9), CreateDate(2004, 9, 27),
CreateDate(2004, 10, 2), CreateDate(2004, 10, 8));
// Create a XYChart object of size 620 x 280 pixels. Set background color to light green (ccffcc)
// with 1 pixel 3D border effect.
c = cd.XYChart(620, 280, "0xccffcc", "0x000000", 1);
// Add a title to the chart using 15 points Times Bold Itatic font, with white (ffffff) text on a
// dark green (0x6000) background
c.addTitle("Multi-Layer Gantt Chart Demo", "Times New Roman Bold Italic", 15, "0xffffff"
).setBackground("0x006000");
// Set the plotarea at (140, 55) and of size 460 x 200 pixels. Use alternative white/grey
// background. Enable both horizontal and vertical grids by setting their colors to grey (c0c0c0).
// Set vertical major grid (represents month boundaries) 2 pixels in width
c.setPlotArea(140, 55, 460, 200, "0xffffff", "0xeeeeee", cd.LineColor, "0xc0c0c0", "0xc0c0c0"
).setGridWidth(2, 1, 1, 1);
// swap the x and y axes to create a horziontal box-whisker chart
c.swapXY();
// Set the y-axis scale to be date scale from Aug 16, 2004 to Nov 22, 2004, with ticks every 7 days
// (1 week)
c.yAxis().setDateScale(CreateDate(2004, 8, 16), CreateDate(2004, 11, 22), 86400 * 7);
// Add a red (ff0000) dash line to represent the current day
c.yAxis().addMark(CreateDate(2004, 10, 8), c.dashLineColor("0xff0000", cd.DashLine));
// Set multi-style axis label formatting. Month labels are in Arial Bold font in "mmm d" format.
// Weekly labels just show the day of month and use minor tick (by using '-' as first character of
// format string).
c.yAxis().setMultiFormat(cd.StartOfMonthFilter(), "<*font=Arial Bold*>{value|mmm d}",
cd.StartOfDayFilter(), "-{value|d}");
// Set the y-axis to shown on the top (right + swapXY = top)
c.setYAxisOnRight();
// Set the labels on the x axis
c.xAxis().setLabels(labels);
// Reverse the x-axis scale so that it points downwards.
c.xAxis().setReverse();
// Set the horizontal ticks and grid lines to be between the bars
c.xAxis().setTickOffset(0.5);
// Use blue (0000aa) as the color for the planned schedule
plannedColor = "0x0000aa";
// Use a red hash pattern as the color for the actual dates. The pattern is created as a 4 x 4
// bitmap defined in memory as an array of colors.
actualColor = c.patternColor(Array("0xffffff", "0xffffff", "0xffffff", "0xff0000", "0xffffff",
"0xffffff", "0xff0000", "0xffffff", "0xffffff", "0xff0000", "0xffffff", "0xffffff", "0xff0000",
"0xffffff", "0xffffff", "0xffffff"), 4);
// Add a box whisker layer to represent the actual dates. We add the actual dates layer first, so it
// will be the top layer.
actualLayer = c.addBoxLayer(actualStartDate, actualEndDate, actualColor, "Actual");
// Set the bar height to 8 pixels so they will not block the bottom bar
actualLayer.setDataWidth(8);
// Add a box-whisker layer to represent the planned schedule date
c.addBoxLayer(startDate, endDate, plannedColor, "Planned").setBorderColor(cd.SameAsMainColor);
// Add a legend box on the top right corner (595, 60) of the plot area with 8 pt Arial Bold font.
// Use a semi-transparent grey (80808080) background.
b = c.addLegend(595, 60, False, "Arial Bold", 8);
b.setAlignment(cd.TopRight);
b.setBackground("0x80808080", -1, 2);
// Output the chart
chart1URL = c.makeSession(GetPageContext(), "chart1");
// Include tool tip for the chart
imageMap1 = c.getHTMLImageMap("", "",
"title='{xLabel} ({dataSetName}): {top|mmm dd, yyyy} to {bottom|mmm dd, yyyy}'");
</cfscript>
<html>
<body style="margin:5px 0px 0px 5px">
<div style="font-size:18pt; font-family:verdana; font-weight:bold">
Multi-Layer Gantt Chart
</div>
<hr style="border:solid 1px #000080" />
<cfoutput>
<div style="font-size:9pt; font-family:verdana; margin-bottom:1.5em">
<a href='viewsource.cfm?file=#CGI.SCRIPT_NAME#'>View Source Code</a>
</div>
<img src="getchart.cfm?#chart1URL#" usemap="##map1" border="0" />
<map name="map1">#imageMap1#</map>
</cfoutput>
</body>
</html> |